The Probability Domain: Measure, Convergence, and Which of Your Training Claims Are Theorems
A standalone tutorial, not a survey: probability as a measure and the σ-algebra as the list of questions you may ask, why that is forced (Vitali) and what it buys (conditioning, filtrations, independence as statements about σ-algebras), a random variable as a measurable function and a density as a Radon–Nikodym derivative with KL's infinities and the GAN support problem falling out, the three integral-limit theorems that license every gradient of an expectation and the one loss where they fail, conditional expectation as the L2 projection that makes the regression function optimal by theorem and the Borel–Kolmogorov paradox computed both ways, the four modes of convergence with the typewriter and escaping-mass counter-examples and the law of the iterated logarithm as the envelope a running mean cannot escape, the central limit theorem as a Fourier theorem with its Berry–Esseen rate and the infinite-width network as a CLT, concentration of measure from Markov to Gaussian Lipschitz with the geometry of d = 4096 and the eval-set error bar table, martingales under SGD, peeking and anytime-valid tests, ergodic theorems under MCMC, Langevin and diffusion as SDE reversal, minimax risk and the price of a density in high dimension, conditional independence as architecture and de Finetti as the licence for Bayesian inference, eleven checkpoint and three diagnostic exercises, and an appendix that grades every connection to our earlier posts by how much it actually proves.
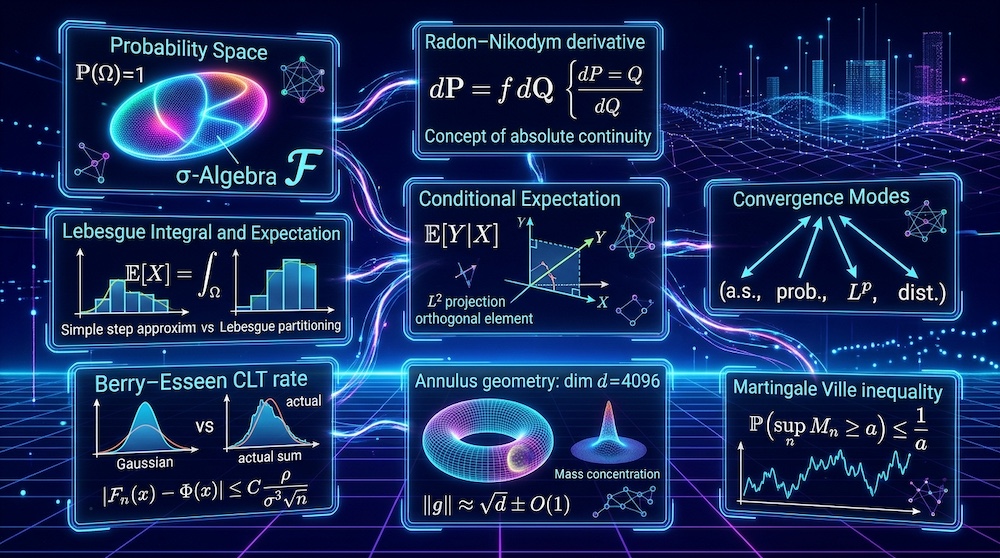
Start with the one sentence everything else hangs on, stated with the two words that are usually dropped. A probability is a measure — a countably additive function from a σ-algebra of events to with — and a random variable is a measurable function on that space. Nothing else is primitive. "Random", "uniform", "given", "independent", "converges" and "expected" are all defined in terms of those two objects, and every time one of them produces a paradox it is because the measure or the σ-algebra was left implicit and two readers filled it in differently. Draw a "random chord" of a circle and ask how often it is longer than the inscribed triangle's side: three natural constructions give , and , and all three are correct, because "random chord" named no measure. Condition a uniformly random point on a sphere on its lying on a great circle, and the answer depends on which family of events shrinks to that circle — a band of latitude gives a uniform law on the circle, a band of longitude gives one proportional to the cosine of latitude. §0 shows both with numbers. Every result in this piece is a consequence of taking that sentence seriously, including the cases where a quantity that looks like a probability is a density and can exceed one, and where a sequence that "converges" does so in a mode that licenses nothing you wanted.
Here is the claim, at the width the mathematics supports, because the tidy version is wrong in both directions. We are not claiming that machine learning is measure theory wearing a hat, and we are not claiming that a practitioner needs to see a non-measurable set to train a model — nobody meets one, and we say exactly where the σ-algebra stops mattering. The claim is this:
Probability theory supplies the objects that every training claim is a statement about, and the mode in which each claim is true. "The MSE-optimal predictor is the conditional mean" is an exact theorem about an projection. "SGD converges" is true almost surely under Robbins–Monro conditions and false in that mode at a constant step under persistent gradient noise. "The sample mean is within one standard error" is a central-limit statement that the law of the iterated logarithm says fails infinitely often. "A long rollout estimates the stationary distribution" is an ergodic theorem with a precondition the episodic case violates. "Random vectors in are nearly orthogonal" is a concentration inequality with a number attached. The value of the lens is not that everything is secretly probability. It is that it tells you which of your claims are theorems, which are theorems in a weaker mode than you assumed, and which are hypotheses.
Companion notebooks. Every number in this piece is a printed line of
worked_numbers.py(53 numbered sections, NumPy only, seeded), and the sections reproduce cell by cell in three executed notebooks:00_probability_from_scratch.ipynb(§1–§14, with the companion basics' A1–A18),01_concentration_and_chains.ipynb(§15–§53) and02_fast_path.ipynb(the fourteen fast-path stops only).
Every connection in this piece carries one of four labels — the same four as our Information Domain piece, so the two can be read as chapters of one book. If you are here for the eval error bar, skip to §7 and come back to this table the first time a label stops you:
| Level | What it means | What you may conclude |
|---|---|---|
| L1 — exact theorem | The quantities and assumptions match a proven result | An identity or a bound that holds under the listed assumptions — not necessarily tight, and the assumptions need not hold in the application |
| L2 — variational correspondence | The objective has the same optimisation structure, with every term defined | A formal analogy you can compute with |
| L3 — engineering heuristic | A similar mechanism appears, with assumptions unchecked | Design intuition, to be validated |
| L4 — speculative analogy | A resemblance without a derivation | A hypothesis to test, nothing more |
Where a connection has two parts we grade both: the theorem, and the claim that the machine-learning object satisfies its hypotheses. Gaussian concentration is L1; "trained embeddings satisfy it" is L3; the two grades sit side by side in §7, §6 and §9 rather than being averaged into one.
Four running examples carry the same numbers through the whole piece, so that when two sections seem to disagree you can see which one is wrong.
- E1 — the fair coin and its sequence space : the object that needs an extension theorem to exist (§1), the first home of the strong law and the law of the iterated logarithm (§5), the typewriter sequence (§5), the test martingale a peeking analyst cannot beat (§8).
- E2 — a two-class Gaussian mixture in dimensions, class means with , identity covariance, equal priors: its Bayes classifier and Bayes risk in closed form (§4), logistic regression's learning curve against that floor (§4), the eval-set error bar on it (§7), and SGD's iterates on it under four step-size schedules (§8).
- E3 — the standard Gaussian vector in dimensions: the norm that concentrates at with a standard deviation that does not grow (§7), cosines that shrink as (§7), the Johnson–Lindenstrauss projection (§7), covariance estimation at five sample sizes (§7), and the infinite-width network whose output is a Gaussian by the central limit theorem (§6).
- E4 — the AR(1) process at and its continuous-time twin, the Ornstein–Uhlenbeck diffusion: the stationary chain whose time average has a computable variance inflation of (§9), the Langevin sampler whose Euler discretisation is biased by a closed-form factor (§9), the forward process of a diffusion model and its exact time reversal (§9), and the same AR(1) our Information Domain piece used for its entropy rate.
Prerequisites. Calculus, including limits of sequences; linear algebra at the level of eigenvalues; the words "mean" and "variance"; gradient descent. No measure theory is assumed, and some is taught: §1 to §3 build the four objects the rest of the piece is written in — the σ-algebra, the measurable function, the Lebesgue integral and the Radon–Nikodym derivative — from those prerequisites, and build only those; a reader meeting them for the first time should expect §1 to §3 to be the slowest sections, not the easiest, and the fast path below is for the reader who would rather take the objects on trust and return for them. Two kinds of section follow. §1 to §5, §7 and §8 are built from the stated prerequisites: each theorem they use is stated with its hypotheses and either proved, sketched, or reduced to a named result the text has already given. §6.5–§6.6, §9.3–§9.4, §10.2–§10.3 and §11 state theorems with their assumptions and a reference and do not pretend to prove them; those sections are read for what a theorem licenses and what it does not, and they are marked optional in the paths below. If you know measure theory, §1 to §3 are a fast re-read with the machine-learning consumers attached; the new material for you starts at §4.
Three reading paths, and the sections none of them may skip. The piece is six modules — Foundations §1–§4; Limits §5–§7.1; Evaluation §7.6, §8.2 and Appendix C.1; Optimisation §3.3 and §8.4; Sampling §9; Advanced §6.5–§6.6, §9.4, §10 and §11, the last of these optional — and the paths are routes through them.
The fast path, for the practitioner who wants the eval error bar and the SGD claim and will come back for the objects, has fourteen stops, each marked by a banner under its heading: §0, §2.2, §2.3, §2.4, §3.3, §4.2, §5.1, §5.4, §7.6, §8.2, §8.3, §8.4, §12 and §13, in that order. Its destination is §7.6, the eval error bar, which is stop 9; the numbers quoted at the fourteen stops run on their own in 02_fast_path.ipynb. If you only have two hours, start here and stop at §13. The fast path is a route through fourteen selected results, not a substitute for the objects behind their proofs: a claim quoted at a stop is proved in a section the path skips, and the hypotheses the stop's number rests on are stated there.
The full practitioner path is §0 → §1 → §2 → §3 → §4 → §5 → §7 → §8 → §12 → §13, doing the checkpoint exercises that lie on it. The theorist path is §0 → §1 → §2 → §3 → §4 → §5 → §6 → §7 → §8 → §9 → §10 → §11. §1 through §5 are on both full paths: §1 and §2 are the objects, §3 is why your gradient estimator is allowed to exist, §4 is the one theorem a practitioner uses every day without naming it, and §5 is the vocabulary in which every later claim is stated. §6 (the central limit theorem as a Fourier theorem) is the bridge to our frequency-domain pieces and is where a practitioner who liked those should go. §9 (chains, ergodicity, Langevin, diffusion) and §10 (minimax and the price of a density) are the advanced branches, optional on every path; take them by interest. §11 (conditional independence and exchangeability), also optional, is the on-ramp to a forthcoming piece on Bayesian and non-parametric inference and can be read on its own. The history is Appendix A, the audit of where this machinery is load-bearing outside machine learning is Appendix B, two toy cases of ours are Appendix C, and the graded ledger of how this piece bears on our earlier posts is Appendix D. This piece stands alone: where an earlier post of ours is relevant it is linked as a citation, the way a paper would be, and nothing below requires having read it.
Companion code. Every number in a code block below is copied from the printed output of
worked_numbers.py, a single NumPy script with 53 numbered sections, float64, CPU-only, that ships with this piece; a section number in the form§Nbeside a block names the section that printed it, the numbers are verbatim, and where a line's label has been shortened for the page the full label is in the script's output file. The script's shared generator is seeded once,default_rng(20261022), and §1 to §31 draw from it in order; §32 to §53, added across four rounds of external review, each draw from a generator of their own (seeded2026_1016_NNfor sectionNN) and never from the shared one, so that adding them left the §1–§31 output byte-identical. Every Monte Carlo value in §1 to §53 that is compared to a theory value is printed with its standard error, computed from the draws the section already makes; the one block whose quantity has no finite variance (§11, the Pareto block means) says so in place of a bar. Atest_worked_numbers.pybeside the script re-derives the closed-form values the blocks are compared against. The two companion notebooks —00_probability_from_scratch.ipynb(measure, random variable, conditioning, the four convergences, the CLT by characteristic functions, concentration) and01_concentration_and_chains.ipynb(eval error bars, the peeking experiment, the AR(1) and Metropolis chains, Langevin, the diffusion reversal, the infinite-width network) — ship beside it, built from those sections cell by cell; each cell restores the script's generator state at its section, so a notebook prints this piece's numbers whether it is run top to bottom or one cell at a time. A third,02_fast_path.ipynb, runs only the sections quoted at the fourteen fast-path stops, in the order of the path, with the same state restore.
Units and conventions, once. Logarithms are natural and divergences are in nats unless a line says bits — this is a probability piece, and every theorem below is stated with ; our Information Domain piece worked in bits and said so at every table. "a.s." means almost surely: with probability one. is the standard normal distribution function. is the indicator of the event . is the σ-algebra generated by , defined in §1. We write with the mode attached whenever it matters, which is every time in §5 and §8.
0. Three puzzles that are one puzzle
Fast path · stop 1 of 14. Next stop: §2.2. This section's numbers run in
02_fast_path.ipynb.
Probability is counter-intuitive in a specific way. The puzzles that trip people up are almost never about computation; they are about which question is being asked. Three of them, each resolved by naming the object the question left out, and each the seed of a section below.
Bertrand's chord (1889). Draw a chord of the unit circle "at random". The inscribed equilateral triangle has side ; how often is the chord longer? Three constructions, each uniform in some variable, each a legitimate probability measure on the set of chords:
§1 1,000,000 chords per construction
(a) two uniform endpoints P(L > sqrt3) = 0.3324 (theory 1/3)
(b) uniform distance to centre P(L > sqrt3) = 0.4994 (theory 1/2)
(c) uniform midpoint in the disc P(L > sqrt3) = 0.2491 (theory 1/4)
(SE of the three lines above: ± 0.0005, ± 0.0005, ± 0.0004 — binomial sqrt(p(1-p)/N) at N = 1,000,000; the largest |measured - theory| is 2.0 SE)None of these is wrong. "Uniform" is not a property of a set; it is a property of a measure on a set, and the set of chords carries three natural ones that disagree. The lesson is not "probability is ambiguous". It is that a probability question is a question about a specified measure, and when a machine-learning claim says "sample uniformly from the data manifold", "a random initialisation", or "an uninformative prior", it has either specified the measure or it has not yet said anything. §1 makes the object precise; §10 returns to the uninformative prior.
Monty Hall (1975). Three doors, one car. You pick door 1; the host, who knows where the car is and always opens a goat door you did not pick, opens door 3. Switch?
§2 1,000,000 games: stay wins = 0.3332 switch wins = 0.6668 (theory 1/3, 2/3)
(SE of the line above: ± 0.0005 for either frequency — binomial sqrt(p(1-p)/N) at N = 1,000,000)The number is not the puzzle. The puzzle is that "the host opened door 3" is being conditioned on, and the probability of that event depends on the host's rule — on what he would have done had the car been behind door 1 (open 2 or 3 at random) versus door 2 (he must open 3). A host who opens a door at random and happened to reveal a goat gives a different answer (). The event "door 3 opened" is the same event for both hosts; what differs is the measure on a sample space large enough to contain the host's choice — is for the knowing host and for the ignorant one — and the measure is what encodes the mechanism. Conditioning is a computation inside a specified probability space, not on the event alone. §4 is this sentence made exact, and it is the sentence under every "condition the model on the observation" claim.
The great circle (Borel, 1909; Kolmogorov, 1933). A point is uniform on the unit sphere. Condition on its lying on a particular great circle. What is its distribution along the circle? The event has probability zero, so the elementary formula is , and the only way to give an answer is to pick a family of positive-probability events shrinking to the circle and take a limit. Pick the circle to be the equator and shrink a band of latitude onto it; or pick the same circle as a meridian and shrink a band of longitude onto it (the code's band takes the half of the meridian at longitude ; the other half gives the same histogram by symmetry):
§6 4,000,000 uniform points on the sphere
(i) equator via latitude band: longitude histogram (6 bins) = [0.1659 0.1707 0.1645 0.1664 0.1645 0.168 ]
(ii) meridian via longitude band: latitude histogram (6 bins) = [0.0665 0.1833 0.2528 0.2468 0.1876 0.0631]
cos(latitude) at bin centres, normalised = [0.067 0.183 0.25 0.25 0.183 0.067 ]Same curve on the sphere, two conditional densities: uniform in the first limit, proportional to in the second. Neither is "the" conditional distribution given the circle, because there is no such thing; there is a conditional distribution given a σ-algebra, and the two bands generate different ones. §4 states the theorem that resolves this (regular conditional distributions exist, and are defined relative to a σ-algebra, not an event), and the consequence for anyone who conditions a model on an exact continuous observation — an inpainting mask, a constraint — is to write down the observation model. A regular conditional distribution exists in every case (§4.4); what the paradox turns on is whether its value at one specific is pinned down, and that is a property of the conditional kernel's regularity in , not of whether the joint law has a density. A singular joint law can have a perfectly regular kernel: is singular with respect to area in the plane, yet at every , weakly continuous in , and every shrinking interval of around agrees on it. A law with a continuous joint density has the canonical version wherever , under the domination condition §4.4 states; singularity alone decides nothing in either direction. So the consequence for a generative model with a low-dimensional latent (§2.2) is not "its law is singular, so no canonical version exists" but "whether its kernel at the observed coordinates has a continuous version is a property of that learned pushforward, and one you have not verified" — which is why the observation model has to be stated; §4.4 separates that from the algorithmic differences between guidance methods, which are not of this kind.
The three puzzles are one puzzle. In each, a word that sounds primitive — random, given, on — hides a choice of measure or of σ-algebra, and the arithmetic cannot be done until the choice is made. The rest of this piece is the machinery for making those choices explicit, and then the theorems that become available once they are.
1. A probability is a measure, and the σ-algebra is the list of questions
Not on the fast path. The practical destinations — the eval error bar (§7.6) and the SGD claim (§8.4) — do not depend on this section; it supplies the objects those claims are stated in — the σ-algebra, the filtration and the almost-sure mode — for the reader who wants to see what they rest on.
1.1 The three axioms, and why "countably" is the whole point
Kolmogorov's 1933 definition. A probability space is a triple :
- is a set, the sample space — the set of everything that could happen, at whatever resolution you choose to describe it;
- is a σ-algebra on : a collection of subsets, called events, that contains , is closed under complement, and is closed under countable unions (hence countable intersections);
- is a probability measure: , and for any sequence of pairwise disjoint events in ,
That last property, countable additivity, is the one that does the work, and it is the one that elementary treatments quietly replace with finite additivity. The difference is not pedantry. Countable additivity is equivalent, given finite additivity, to continuity: if then , and if then .
Continuity is what lets a probability pass through a limit — and every limit theorem in this piece, from the strong law to the martingale convergence theorem, is a statement that some sequence of events has a probability that converges to the probability of a limiting event. Drop countable additivity and the strong law of large numbers is not false; it is unstatable, because "the running mean converges" is a countable intersection of countable unions of events, which lies outside the algebra of finite-dimensional cylinder sets, and finite additivity alone determines no value for it.
A measure that is not required to total one is just a measure; Lebesgue measure on , which assigns to an interval its length, is the one that will matter. Everything in this subsection holds for σ-finite measures, with one exception: continuity from above needs some of finite measure ( while for every ). That is why the same machinery serves densities (§2) and integrals (§3).
1.2 Why not every subset: the one pathology, and then never again
Why does the definition need at all? Why not let every subset of be an event? For a finite or countable you can, and should: , and a probability is a list of non-negative numbers summing to one. The need arises on , and it arises from a theorem.
Vitali (1905). There is no function that is countably additive, translation-invariant (modulo 1), and assigns the value one.
Optional — why the σ-algebra is forced. The sketch, for the reader who wants to see the set. Call if is rational, and use the axiom of choice to pick one representative from each equivalence class; call the set of representatives . The rational translates (mod 1), , are countably many, pairwise disjoint, and cover — which has the same measure as , since a single point has countably many disjoint translates of equal measure inside and so has measure zero. By countable additivity and translation invariance, — a countable sum of a single number, which is or , never .
So a "uniform distribution on " in the only sense that supports limits cannot be defined on every subset. It can be defined on the Borel σ-algebra — the smallest σ-algebra containing the intervals — and, slightly larger, on the Lebesgue-measurable sets.
Every set you will ever write down (intervals, their countable unions and intersections, preimages under continuous or Borel-measurable functions, limits of all of these) is Borel — under a merely Lebesgue-measurable function the preimage of a Borel set is Lebesgue-measurable, not necessarily Borel, which is all this section needs — and the one exception is forward images and projections (Suslin, 1917: the projection of a Borel subset of the plane is analytic, hence Lebesgue-measurable, but not always Borel).
The Vitali set needs the axiom of choice to exist and cannot be described by a rule. A practitioner will never meet a non-measurable set, and this is the last time this piece mentions one. The σ-algebra is forced by Vitali, but once it is there it does a second job that has nothing to do with pathology, and that second job is why it stays in the definition.
1.3 The second job: a σ-algebra is information
Take a random variable (defined in §2; for now, a function whose preimages of intervals are events). The σ-algebra generated by ,
is the collection of events that can be decided by looking at alone — "", "", " is rational" — and not the events that cannot, like "" for an unrelated . A sub-σ-algebra is in general a list of questions you are allowed to ask, closed under and, or, not, and countable versions of these. Three consequences, each a section of this piece:
- A function of the data is the same thing as a -measurable function. This is the Doob–Dynkin lemma: a random variable is -measurable if and only if for some Borel function . It is what makes "a predictor that depends only on the input" a mathematical object, and it is what §4 projects onto.
- Information over time is an increasing sequence of σ-algebras, a filtration , where is what is decidable after steps. "A stopping rule that does not look into the future" means a random time with for every . That single line is the definition under every early-stopping, checkpoint-selection and sequential-testing argument in §8.
- Independence is a statement about σ-algebras: and are independent when for every and , and conditional independence (§11) is the same with a third σ-algebra conditioned on. "Independent" is not a property of two numbers; it is a property of two lists of questions.
1.4 Existence: three theorems that let you say "an i.i.d. stream" at all
Here is a question that sounds silly and is not. E1 is an infinite sequence of fair coin flips. Does a probability space carrying it exist? Finite additivity on finite sequences is easy — to each of the strings. The infinite sequence space is uncountable, every individual infinite string must have probability zero, and the measure has to be countably additive on a σ-algebra large enough to contain "the running mean converges to ", which is not a statement about any finite prefix. Three theorems, in increasing generality:
Carathéodory's extension theorem. A non-negative countably additive set function on an algebra (closed under finite operations) — a premeasure — extends to a measure on the σ-algebra it generates, uniquely when it is σ-finite. Together with the π–λ theorem (Dynkin): two probability measures that agree on a collection closed under finite intersections — a π-system — agree on the σ-algebra it generates. The second half is the one practitioners use without knowing: specifying a distribution function specifies the whole law, because the half-lines form a π-system generating . Likewise specifying specifies a joint law.
Product measure. Given probability spaces for and for , there is exactly one measure on the product σ-algebra under which . "A dataset of independent samples" is a point of the -fold product space, and "i.i.d." is the statement that the joint law is the product of copies of one marginal. Fubini's theorem (§3) is the theorem about integrating against a product measure.
Kolmogorov's extension theorem (1933). Three things you want to be allowed to say, and this is the theorem that allows them: that a product measure exists for infinitely many factors, so an i.i.d. stream is an object and not only an -sample; that any consistent family of marginals is the family of some process, so "a stochastic process with these finite-dimensional laws" names something; and that all of these live on one space , which an almost-sure statement about the whole sequence — E1's running mean converging — needs in order to be an event at all.
The statement: given a consistent family of finite-dimensional distributions — a law for for every , each the marginal of the next — there is a unique probability measure on (with the σ-algebra generated by the coordinates) having those marginals. This is the theorem that makes E1 exist, and with it every "infinite stream of training batches", every "stochastic process", every Markov chain of §9. (On general spaces it needs the coordinate spaces to be standard Borel — Polish spaces with their Borel sets — which every space in this piece is.)
At a glance — the three theorems, what each takes in and what it hands back:
| Theorem | You give it | It gives you | What it lets a practitioner say |
|---|---|---|---|
| Carathéodory (+ π–λ) | a countably additive set function on an algebra (finite operations only); or two laws agreeing on a π-system | one measure on the generated σ-algebra, unique | "the distribution function is the law" — half-lines generate ; a joint CDF is a joint law |
| Product measure | a probability space for and one for | the unique law on the product σ-algebra with | " i.i.d. samples" — a point of the -fold product; Fubini (§3.4) integrates against it |
| Kolmogorov extension | a consistent family of finite-dimensional laws, one for every , each the marginal of the next | one law on with those marginals, on one space | "an i.i.d. stream", "a stochastic process", "the running mean converges" as an event — E1 exists; so does every chain of §9 |
The point of listing these is not that you will invoke them. It is that the i.i.d. assumption is a construction, not an observation: the product measure is an object you chose, and the theorems below are theorems about that object. When the data are not a product — a time series, a conversation, a sequence of agent actions — the object is a different measure on the same sequence space, and §9 and §11 are about which theorems survive.
1.5 Almost surely, and the two Borel–Cantelli lemmas
An event holds almost surely (a.s.) if . It is not "surely": the complement is non-empty, merely null. A uniform variable on takes some value, and takes any particular value with probability zero. The rationals are dense in — every interval contains infinitely many — and have Lebesgue measure zero, being a countable union of points:
§3 Riemann upper sum = 1, lower sum = 0 on every partition -> not Riemann integrable
Lebesgue: lambda(Q cap [0,1]) = 0 -> integral of 1_Q = 0 (a countable union of points)So "a uniform draw is irrational" holds a.s. and is not certain, and the indicator of the rationals — a function that is on a dense set — integrates to zero. That last line is also the first hint of why the integral of §3 is Lebesgue's and not Riemann's: the Riemann integral of does not exist, and the Lebesgue integral is without fuss.
Two lemmas about infinitely many events, used constantly below. Write — infinitely often — for , the event that infinitely many occur.
- Borel–Cantelli I. If then . No independence needed. This is how almost-sure convergence is usually proved: show the probabilities of the bad events are summable.
- Borel–Cantelli II. If the are independent and then .
Together: for independent events, "infinitely often" has probability or , decided by a single series. That is a special case of Kolmogorov's 0–1 law: any event in the tail σ-algebra of an independent sequence — any event unchanged by altering finitely many of the — has probability or . "The running mean converges" is a tail event, so for an i.i.d. sequence the strong law of §5 is either true a.s. or false a.s.; there is no middle. Whether the iterates of a stochastic optimiser converge is not in general a tail event — the early steps matter — which is one reason §8 needs martingales rather than a 0–1 law.
Checkpoint exercise 1a. E1 again. (i) Fix a finite pattern — say ten heads in a row. Does it occur infinitely often along the sequence, almost surely, and which Borel–Cantelli lemma decides it? (ii) Write , heads . Is the event in ? In ? (Answers: (i) Yes, a.s. Overlapping occurrences are not independent, so cut the sequence into disjoint blocks of ten and let be "block is all heads": the are independent with , the series diverges, and Borel–Cantelli II gives ; infinitely many full blocks are infinitely many occurrences. Borel–Cantelli I says nothing here: its hypothesis, a summable series, fails. (ii) No: is decided by , which cannot ask about; it is in — compare §1.3's stopping-time definition.)
1.6 Where this touches a loss function already
Our Information Domain piece opened with the typical set: for an i.i.d. source, the sequences whose empirical log-probability is close to the entropy have total probability tending to one while being an exponentially vanishing fraction of all sequences — for a source that is not uniform; a uniform source has , every sequence is typical, and the two agree.
In this section's vocabulary that is a statement about a measure on E1's sequence space — a set of sequences that is small as a set and large in measure — and the asymptotic equipartition property it rests on is the strong law of large numbers applied to , which §5 states and §9 extends from i.i.d. to ergodic. The point for now is only that "most sequences" in machine learning always means "most of the measure", never "most of the set", and the two can disagree by a factor of .
The objects you actually need, on one page. Ten of them carry the whole piece; the table says what each is in one line and where it is defined, so that a later section can be read without re-deriving its vocabulary.
| Object | What it is | Where defined |
|---|---|---|
| Sample space | The set of everything that could happen; scaffolding that no computation refers to, needed so that several random variables can share one | §1.1, §2.1 |
| σ-algebra | The list of questions you may ask: a family of subsets closed under complement and countable union; a sub-σ-algebra is a smaller list, i.e. less information | §1.1, §1.3 |
| Measurable function (random variable) | A map whose preimages of Borel sets are events, so that is defined; is -measurable iff (Doob–Dynkin) | §1.3, §2.1 |
| Pushforward law | The distribution of : , the only thing a model ever needs about its data | §2.1 |
| Density as a Radon–Nikodym derivative | , the function whose integral over is ; a ratio of a probability to a length, not a probability | §2.2 |
| Absolute continuity | Every -null set is -null; the condition for a density of with respect to to exist, and necessary — not sufficient — for to be finite, which also needs the log-ratio to be -integrable (§2.4: a Cauchy against a Gaussian has the density and infinite KL) | §2.2, §2.4 |
| Conditional expectation | For , the -measurable random variable closest to in — a projection; it exists for every integrable , as the -measurable with for all , and only the projection description needs — defined relative to a σ-algebra, not an event | §4.1, §4.2 |
| Filtration | An increasing sequence of σ-algebras: what is decidable after steps | §1.3, §8.1 |
| Stopping time | A random time with for every : a rule that does not look into the future | §1.3, §8.2 |
| Mode of convergence | Which of four statements "" makes — almost surely, in probability, in , in distribution — and hence what it licenses | §5.1 |
Every later section refers back to this table; if a term is opaque, return here.
Checkpoint exercise 1b. Let be a fair coin flip and an independent fair die. Which of these events are in : (a) ; (b) ; (c) ; (d) ; (e) ? Then: is "" a tail event for E1, and is " for all "? (Answers: (a), (d); yes — altering finitely many flips does not change the limit; no — altering the first flip can break it.)
2. A random variable is a function; a density is a derivative
2.1 Measurable maps and pushforward: where "the distribution of " lives
A random variable (§1.6 glossary) is a function that is measurable: for every Borel set . Measurability is the condition that lets be applied to statements about , and it is almost never a constraint in practice — every continuous function, every function built from continuous functions by countable limits, every function you can write in a framework is measurable. A random vector is the same with ; a random element of any standard Borel space (a function space, a space of images, a set of token sequences) is the same with that space.
The law or distribution of is the pushforward measure (§1.6 glossary) on : . The distribution function is , and by the π–λ theorem of §1.4 it determines . The one identity that practitioners use ten times a day and textbooks call "the law of the unconscious statistician" is the change-of-variables formula for the pushforward,
valid for Borel with or integrable, which says you may forget and integrate over the range. It is a theorem (prove it for indicators, then simple functions, then by the limit theorems of §3), and it is the reason a model only ever needs the law of its data and not the sample space (§1.6 glossary) the data were drawn on.
is scaffolding. No computation in machine learning ever refers to ; everything is a statement about laws, which is why the pushforward is the first thing to define. The scaffolding matters at exactly two moments: when a limit theorem needs several random variables to live on one space (§5's almost-sure convergence is a statement about -by- convergence, which has no meaning without a shared ), and when two constructions produce the same law but different joint behaviour — a coupling, two random variables on one with prescribed laws, which is how §2.4's Wasserstein distance is defined.
Checkpoint exercise 2a. Let be uniform on and . (i) Find the law of — its distribution function and its density. (ii) Is ? Name an event in one and not the other. (Answers: (i) For , , so and the pushforward has density on : it is at and at , unbounded as , and still — a density is a Radon–Nikodym derivative, not a probability (§2.2). (ii) Yes, strictly. Every event in has the form and is unchanged by the reflection ; the event is in and is sent by that reflection to , a different event, so it is not in . In the words of Doob–Dynkin (§1.3), is not a Borel function of : knowing the square cannot decide the sign, and squaring threw a question off the list.)
2.2 Densities: absolute continuity and the Radon–Nikodym derivative
Fast path · stop 2 of 14. Next stop: §2.3. This section's numbers run in
02_fast_path.ipynb.
A density is not primitive either. Given two measures and on the same space, say is absolutely continuous with respect to , written (§1.6 glossary), if every -null set is -null: . Then:
Radon–Nikodym theorem. If and both are σ-finite, there is a -a.e. unique measurable with
written . Conversely if is given by such an then .
A probability density function (§1.6 glossary: the density as a Radon–Nikodym derivative) is the case , Lebesgue measure: exists exactly when assigns zero to every set of length zero. A probability mass function is the case counting measure on a countable set. These are the same object with respect to different base measures, and three facts that cause real errors follow immediately:
- A density is not a probability. It is a derivative — a ratio of a probability to a length — and can exceed one; has density at zero. A model's log-likelihood on continuous data is not bounded above by zero.
- A density depends on the base measure, so likelihoods are comparable only against the same one. The log-likelihood of a continuous model on data that are actually discrete (8-bit pixels, quantised audio) is not a well-posed number: the data law is a sum of point masses, which is singular with respect to Lebesgue measure, and a continuous model can drive its density at the data points to infinity by concentrating mass there. Theis, van den Oord & Bethge (2016) make this point and the field's fix — dequantisation, adding uniform noise in the quantisation cell so that the data law becomes absolutely continuous — is exactly "choose a data measure that is before you compare densities". Reporting bits per dimension is then a well-defined comparison between models under the same dequantised measure, and only that. L1.
- A law can have no density at all and still be perfectly good. The Lebesgue decomposition says that for σ-finite and , splits uniquely as with and (concentrated on a -null set); the singular part further splits into atoms (point masses) and a singular-continuous part. A spike-and-slab prior, a zero-inflated count model, an image distribution with saturated pixels, and the law of any generative model that maps a low-dimensional latent through a smooth decoder into a high-dimensional space all have singular parts — the last one is singular with respect to Lebesgue measure on entirely, since its mass lives on a -dimensional image, a -null set. That observation is the whole of §2.4.
2.3 Change of variables, and what a normalising flow computes
Fast path · stop 3 of 14. Next stop: §2.4. This section has no numeric block; the stops' numbers run in
02_fast_path.ipynb.
If has density on and is a diffeomorphism, then has density
This is the Radon–Nikodym derivative of the pushforward with respect to Lebesgue measure, and the Jacobian is the factor by which rescales volume — Lebesgue measure is not preserved by a general map, and the density has to account for that.
A normalising flow is a parametrised diffeomorphism trained by maximising this expression at the data; the architecture constraints (triangular Jacobians, coupling layers) exist to make cheap.
If is not injective but is still a local diffeomorphism off a null set, the formula becomes a sum over the preimage branches; it fails entirely when sends a set of positive -measure into a -null set — as any map into a space of higher dimension must — which is the formal reason a decoder from to with produces a law without a density on , and why a VAE needs the noise in to have a density at all. (Our Information Domain piece's §6 took that density as given; this is where it comes from.)
Checkpoint exercise 2b. with density , and . (i) Write the density of by the change-of-variables formula. (ii) Can it exceed one? If not, find a whose density does, and say what the extra factor is. (Answers: (i) is a diffeomorphism of onto with and , so for — the lognormal density; the is the Jacobian, the factor by which stretches length near . (ii) Not this one: is maximised where is, at , and . Compress instead: has and , so , the peak is at , and on roughly — while exactly, since the formula is the Radon–Nikodym derivative of the pushforward with respect to Lebesgue measure and the pushforward is a probability. A density above one is a short interval carrying a lot of mass, not an error, and the that put it there is exactly the term a normalising flow adds to its log-likelihood.)
2.4 Divergences as integrated density ratios, and the support problem
Fast path · stop 4 of 14. Next stop: §3.3. This section's numbers run in
02_fast_path.ipynb.
With the Radon–Nikodym derivative in hand, the divergences of our earlier piece are one-line definitions. For probability measures :
The "otherwise" is not a convention; it is forced. If puts mass on a -null set, no density exists and the integral has an infinite part. Three other divergences, each needing less:
- Total variation : always defined, always in , equal to for any common dominating (which always exists: ).
- Jensen–Shannon with : always finite, since and likewise — the log-ratios are bounded above by , not merely defined — and capped at .
- Wasserstein-1 over couplings with marginals and : it needs no density ratio at all, only a metric on the space, and it is finite whenever both laws have a first moment — a sufficient condition, not a necessary one: two standard Cauchy laws shifted by have exactly, by the shift coupling , while neither has a mean (§52) — and it is the one divergence here that uses the scaffolding — a coupling is a joint law with the prescribed marginals, realised as two random variables on one .
The textbook example, which is also the generative-modelling example (KL and JS in nats):
§20 U[0,1] vs U[theta, 1+theta]
theta=0.0 : KL = 0.0, TV = 0.00, W1 = 0.00
theta=0.01: KL = inf, TV = 0.01, W1 = 0.01
theta=0.1 : KL = inf, TV = 0.10, W1 = 0.10
theta=0.5 : KL = inf, TV = 0.50, W1 = 0.50
theta=1.0 : KL = inf, TV = 1.00, W1 = 1.00, JS = ln2 = 0.6931 (saturated)
theta=2.0 : KL = inf, TV = 1.00, W1 = 2.00, JS = ln2 = 0.6931 (saturated)Shift a uniform law by any and the KL is infinite immediately — the supports differ on a set of positive -measure — while TV and grow continuously, and only keeps growing once the supports are disjoint.
( is not, in general, the one that stays finite when KL does not: a first moment of each law is sufficient for finiteness, not necessary — the two shifted Cauchy laws of §52 have with no mean on either side — but without one it can be infinite. The Cauchy-against-Gaussian pair below has and — under any coupling when the first law has no mean and the second does — while TV is finite; the right contrast is "no density ratio needed, finite under a first moment".)
Now take the step from the interval to the image space one object at a time. A generator with a latent produces samples whose law is the pushforward of §2.1 — a probability measure on , , carried entirely by the image , a set of dimension at most and so of Lebesgue measure zero in : by the §2.3 argument is singular with respect to (§2.2) and has no density there, whatever the architecture.
The law of real images is, on the manifold hypothesis, a measure of the same kind carried by a different thin set.
Two steps are being taken here, and only the first is free. That each law is singular with respect to follows from the dimension count alone; but two laws each singular with respect to need not be singular with respect to each other — two laws carried by the same manifold, each with a density against its surface measure, are mutually absolutely continuous and have a finite KL. Mutual singularity needs its own hypothesis on the supports, and that is the one the next paragraph makes.
Two measures carried by different Lebesgue-null sets are, generically, carried by disjoint ones — each singular with respect to the other, which is the shifted-uniform table with past in every direction at once — and you have Arjovsky & Bottou (2017): when the two supports are disjoint low-dimensional sets, KL is infinite, JS is at its cap , a perfect discriminator exists, and the gradient the generator receives through a saturated divergence is zero or unstable.
Three claims sit in that sentence and carry different grades: that the divergence saturates is L1; that a perfect discriminator exists is L1 (the indicator of one support is one); that training therefore behaves as it does is L3 — the first two are statements about a loss surface, the third is about an optimiser on it. The divergence statement is L1 — it is a theorem about absolute continuity, with the numbers above as its one-dimensional instance.
The Wasserstein GAN of Arjovsky, Chintala & Bottou (2017) replaces the JS objective with via its Kantorovich–Rubinstein dual, for , the laws with a finite first moment. The qualifier is load-bearing: outside the coupling definition still stands — the shifted Cauchy pair has — but the displayed supremum is not well defined as written, because the admissible test function has no expectation under either law; a dual over bounded Lipschitz test functions is the formulation that extends. Within it is a divergence that the shifted-uniform table shows stays informative; that WGAN therefore trains better in a given setting is L3, a hypothesis about an optimiser that the theorem does not reach. Our game-theory piece treated the GAN as a minimax game; §10 says what kind of minimax it is.
Action changed — the support diagnostic. Persistent near-perfect discrimination on a sufficiently large independent evaluation sample is evidence of substantial mismatch — not proof that the supports are disjoint. A flexible discriminator memorises a finite training sample to even when and the Bayes accuracy is ; investigate support separation, discriminator overfitting and feature differences before diagnosing divergence saturation. If the supports are the cause, change the measures, not the model's size — add noise to both laws (instance noise, or the dequantisation of §2.2, so that both are and overlap), train against , which stays informative once the supports are disjoint (table above), or fix the generator's support (latent dimension, decoder range). L1 that a discriminator with accuracy one on the two laws exists exactly when they are mutually singular (one direction is the indicator of a support; for the other, a classifier right with probability one under each law names a set of full -measure and zero -measure); L3 that an observed near-perfect accuracy on finite samples means that, and which remedy trains best.
One inequality ties the two families together and is used in §7 and §10. Pinsker's inequality: , KL in nats.
§20 Pinsker check on Bernoulli(0.5) vs Bernoulli(0.6): TV = 0.1, KL(nats) = 0.02041, sqrt(KL/2) = 0.1010 >= TVIt is tight to within one percent here and loose in general; its value is that it converts a KL — which is what likelihood-based training controls — into a bound on the probability of any event, which is what a downstream decision cares about.
Our Information Domain piece's §1.2 was about KL's asymmetry; this section's addition is that the asymmetry is the asymmetry of absolute continuity: and are different conditions, and requires the first — requires, not follows from: even with a density, can be when 's tails are heavier than 's (a Cauchy against a Gaussian has and infinite KL).
Checkpoint exercise 2c. and the law of a fair coin's outcome in . Which of , , , , are finite, and which are at their maximum? (Both KLs are : charges , which is -null, so ; charges , which is -null, so . , , both at their maximum. is finite: the optimal coupling on the line is monotone, sending to and to , so with the standard normal density.)
3. Expectation is a Lebesgue integral, and the three theorems that let you move a gradient inside it
3.1 The construction, in three steps, and why it is not Riemann's
The expectation is defined in three steps, and the order of the steps is the whole idea.
- Simple functions. If for events and constants , then . This is the only place probabilities of events enter.
- Non-negative functions. If , then , which may be . Equivalently, take any increasing sequence of simple functions (one always exists: round down to multiples of and cap at ) and set — the monotone convergence theorem below says the limit does not depend on the sequence.
- General functions. Split with and set , provided at least one is finite. is integrable when .
Riemann partitions the domain into intervals and asks what the function does on each; Lebesgue partitions the range into levels and asks how much measure each level set has. That is why the indicator of the rationals integrates to zero under Lebesgue and fails to exist under Riemann (§1.5): its level sets and have measures and , and that is all the construction asks.
The practical payoff is not that integral; it is that the construction from below by monotone limits gives three theorems about exchanging a limit with an expectation, and those three theorems are what a training loop runs on.
3.2 Monotone convergence, Fatou, dominated convergence — with the counter-example that separates them
Let almost surely — one mode of convergence (§1.6 glossary); §5.1 compares the four.
- Monotone convergence (MCT). If , then . No integrability needed; both sides may be .
- Fatou's lemma. If , then . Mass can escape, never appear.
- Dominated convergence (DCT). If for all with , then and in fact .
Side by side — the hypothesis each theorem charges, what it pays, and what the escaping-mass sequence below does to it:
| Theorem | Hypothesis on a.s. | Conclusion | Escaping mass | Where it is cashed in this piece |
|---|---|---|---|---|
| MCT | , allowed | not monotone — silent | the construction of itself (§3.1); truncations (exercise 3a) | |
| Fatou | strict: — mass escaped | every "the limit can only lose mass" step; the inequality direction of §5.1's row | ||
| DCT | , | , and | no such : has infinite mean — fails | the gradient inside the expectation (§3.3); Fubini's absolute-integrability clause (§3.4) |
| Vitali / uniform integrability | in probability and uniformly integrable | in — the exact condition | for — fails | moment and sub-Gaussian hypotheses of §7–§8 are UI certificates; §5.1's in probability |
The example that shows the dominating function is not decoration is the escaping-mass sequence: with uniform on , let .
§7 100,000 draws of U
escaping mass n= 10: P(X_n != 0) = 0.0997, E[X_n] = 0.997
escaping mass n= 100: P(X_n != 0) = 0.0104, E[X_n] = 1.039
escaping mass n= 1000: P(X_n != 0) = 0.0011, E[X_n] = 1.110
escaping mass n=10000: P(X_n != 0) = 0.0001, E[X_n] = 1.400
(SE of the four lines above, from the same 100,000 points: P(X_n != 0) ± 0.0009, 0.0003, 0.0001, 0.0000; E[X_n] = n · P(X_n != 0) here, so ± 0.009, 0.032, 0.105, 0.374 — the E[X_n] column is a mean of 100,000 terms of which only n^-1 of them are nonzero, which is why it wanders while its expectation is exactly 1)for every , so almost surely; for every (the Monte Carlo values wobble because by only about ten of the sample points are non-zero). The limit of the expectations is , the expectation of the limit is , and Fatou's inequality is strict. No integrable dominates the sequence — the smallest candidate is , which behaves like near zero and has infinite expectation.
The lesson is one sentence: a sequence of estimators can converge to the right thing almost surely while their expectations converge to the wrong thing, and the certificate that rules this out is a dominating integrable function. That certificate is what the next subsection is about.
The general principle, of which domination is the usual certificate. Call a family uniformly integrable if as — no member can keep a fixed amount of its expectation arbitrarily far out. Vitali's convergence theorem (the same Vitali as §1.2): for integrable , in with integrable if and only if in probability and is uniformly integrable. That is the exact condition for the expectations to follow the limit; the DCT is its most-used sufficient case, since with makes the family uniformly integrable at once.
The escaping-mass sequence fails it in the plainest way — for every , so the supremum never falls below — which is the theorem's way of saying the expectations were never going to follow the limit.
Two consequences for the rest of the piece. A family bounded in for some is uniformly integrable (de la Vallée Poussin), which is why §5.1's table places convergence above convergence in probability and why a moment bound is a licence to exchange a limit with an expectation; and sub-Gaussian tails (§7) give every moment at once, so the tail and moment hypotheses of §7 and §8 are more than conveniences — they are the certificates that the quantities whose limits those sections take are uniformly integrable.
Checkpoint exercise 3a. Which of MCT, Fatou and DCT licenses for (a) the escaping-mass sequence ; (b) the truncations of a random variable ; (c) a sequence with for a constant , converging almost surely? (Answers: (a) None. The sequence is not monotone, no integrable dominates it, and Fatou gives only — the inequality is strict and the exchange is false. (b) MCT: , so , both sides allowed to be — no integrability of is needed; if is integrable, DCT with applies as well. (c) DCT with : a constant is integrable on a probability space, so and — the bounded convergence theorem, the case every bounded loss sits in.)
3.3 The gradient of an expectation: two estimators, one theorem, and the loss where it fails
Fast path · stop 5 of 14. Next stop: §4.2. This section's numbers run in
02_fast_path.ipynb.
Every policy gradient, every variational objective, every reparameterised sampler computes or , and the whole question is whether the gradient may be moved inside the expectation.
The theorem is differentiation under the integral sign, which is the DCT applied to difference quotients: if is integrable, exists for a.e. , and the difference quotients are dominated — for all in a fixed neighbourhood of , with — then at every such
The usual certificate for the domination is the mean-value theorem: for a.e. , differentiable on all of with . The order of the quantifiers matters — the neighbourhood is fixed first, then "for a.e. "; "for each , differentiable for a.e. " is weaker, and the 0–1 loss below satisfies the weaker form while failing the theorem's hypothesis — and its conclusion. The two standard estimators are two ways of writing :
-
Score function (REINFORCE, likelihood-ratio). Write and differentiate the density: . Needs: differentiable in with a dominated derivative, and — the condition that silently fails — that differentiating under the integral sign accounts for a moving domain. A support that does not depend on is the convenient sufficient condition, not a necessary one: when the support moves with the formula is not wrong so much as incomplete — Leibniz's rule adds a boundary term, at a moving upper endpoint — and the naive estimator is biased by exactly that term. may be anything integrable, including a non-differentiable reward.
-
Pathwise (reparameterisation). Write with from a fixed law and differentiate the sample: . Needs: the difference quotients of dominated by an integrable on a fixed neighbourhood of , as in the theorem above, and to exist for a.e. . In practice: locally Lipschitz and dominated, so that the quotient is bounded by the local Lipschitz constant of times and that product is integrable; and the law of absolutely continuous, so that the set where is not differentiable is null for every .
" differentiable almost everywhere with dominated" is not enough on its own: it bounds the derivative where it exists and says nothing about the difference quotients across the points where it does not — see the failure below, which satisfies that weaker condition trivially.
The moving-support case, in numbers: and , so the true derivative is ; the score is on the support, so the naive estimator has expectation , and the boundary term restores it:
§33 true d/dtheta E[X] = d/dtheta (theta/2) = 0.5000
naive score-function estimate E[X * d/dtheta log p_theta(X)] = E[-X/theta] = -0.5014 (SE 0.0006; theory -1/2)
boundary term f(theta) p_theta(theta) = theta * (1/theta) = 1.0000
corrected = naive + boundary = +0.4986 (theory +0.5000)
finite-difference check with common random numbers, theta ± 0.01: +0.5014 (theory +0.5000)Same target, very different variance:
§18 d/dmu E[X^2], X ~ N(mu, 1), mu = 1.5, true value 2 mu = 3.0, n = 1000 per estimate, 2000 estimates
score-function: mean 3.0048, sd 0.2356; pathwise: mean 3.0008, sd 0.0644; variance ratio 13.4
(SE of the line above: the two means ± 0.0053 and ± 0.0014 (sd/sqrt(2,000)); the sds ± 0.0038 and ± 0.0010; the variance ratio ± 0.4 by the joint delta method — the two estimators use the same draws in each replication (correlation 0.74; of their squared deviations 0.55), so the ratio's bar carries their covariance; ignoring it would print ± 0.6)Both are unbiased, as the theorem promises when its conditions hold. The pathwise estimator's variance is smaller here because varies less than does; that ratio is problem-dependent and is the reason VAEs reparameterise and the reason discrete latents, where no differentiable in exists, are hard.
Where the theorem fails: the 0–1 loss. Let and with . The true derivative of is .
The pathwise estimator takes at every , so it returns exactly zero: is differentiable almost everywhere and its derivative, wherever it exists, is trivially dominated — but its difference quotients are not dominated near the jump: is of size on a set of probability , so the smallest candidate dominator, of the quotient, is near the jump and has infinite expectation (the escaping-mass sequence of §3.2 again): no integrable bounds the quotients on any fixed neighbourhood of , which is exactly the domination the theorem asks for.
The derivative of the expectation is not the expectation of the derivative, and the theorem said so by refusing a certificate.
The score-function estimator, which never differentiates , still returns in expectation. This is the formal content of "accuracy has no gradient, cross-entropy does": the exchange of and is a theorem with a hypothesis, the 0–1 loss violates it, and a surrogate loss is a different that satisfies the hypothesis — its gradient is unbiased for that objective, a change of target, not a biased estimate of the old one. A straight-through estimator keeps the original forward map and substitutes a derivative, and is biased for the original gradient: the expectation of the replacement is not the derivative. L1 for the whole paragraph.
Theorem card — differentiation under the integral sign. Object: the map , with integrable. Theorem: if the difference quotients of are dominated by one integrable on a fixed neighbourhood of , the derivative of the expectation is the expectation of the derivative (DCT). Guarantee does not apply when: no integrable dominates the difference quotients on a fixed neighbourhood — has a jump that a shift of carries across with probability (the 0–1 loss: quotients of size ), or the support of moves with and the score-function form is used without its boundary term. Counterexample: , (§33): the naive score-function estimator has expectation against a true derivative of , and the boundary term is the whole discrepancy; the 0–1 loss is a second one, the pathwise estimator returning against . Action: before trusting a gradient estimator, name its — a Lipschitz constant of times a dominated for the pathwise form; a dominated and a fixed support, or an explicit boundary term, for the score-function form — and if none exists, either change the objective to a surrogate that has one (unbiased for the surrogate, not for the original) or substitute a derivative under the original forward map (straight-through) and record that it is biased for the original gradient.
3.4 Fubini–Tonelli: averaging over data and over noise
A training objective is routinely a double expectation — over the data and over dropout masks, over the data and over augmentation, over the prompt distribution and over the sampler's randomness — and its gradient is computed by sampling both at once and averaging. The licence is:
Tonelli. For σ-finite and (every probability measure is) and measurable on the product space, , all three possibly . No further condition — but σ-finiteness is real: Lebesgue measure times counting measure on with gives iterated integrals and .
Fubini. For general measurable on the same σ-finite product, the same holds provided .
Losses are usually bounded below and the expected loss is finite, so Fubini applies and the order of sampling does not matter. The counter-example that shows the integrability condition is real is classical: on , has and . The two iterated integrals exist, are finite, and differ, because .
The place integrability bites in practice is importance-weighted objectives: an off-policy estimate equals whenever on and — the change of measure is §2.2's Radon–Nikodym theorem — and an unbounded ratio routinely gives a finite mean with an infinite variance — not a Fubini failure (the target is well defined and the sample average still converges a.s., §5) but a heavy-tailed average with no CLT error bar, dominated by rare enormous weights.
The diagnostic is the importance-sampling effective sample size, for weights : it lies between and , and as the ratio , which for a unit-variance Gaussian target shifted by from a standard Gaussian proposal is :
§36 (a) IS, target N(0.5,1) from N(0,1), n=10,000: ESS = 7824.6, ESS/n = 0.7825 (theory limit E[w]^2/E[w^2] = exp(-mu^2) = 0.7788; max weight share 0.0006)
(a) IS, target N(1.0,1) from N(0,1), n=10,000: ESS = 3737.7, ESS/n = 0.3738 (theory limit E[w]^2/E[w^2] = exp(-mu^2) = 0.3679; max weight share 0.0025)
(SE of the line above: ESS/n ± 0.0138, ESS ± 138.4 — delta method on (mean w)^2 / mean w^2 from the same n = 10,000 weights; at mu >= 2 the weights are heavy-tailed and this SE is itself unreliable, cf. §48)
(a) IS, target N(2.0,1) from N(0,1), n=10,000: ESS = 325.1, ESS/n = 0.0325 (theory limit E[w]^2/E[w^2] = exp(-mu^2) = 0.0183; max weight share 0.0229)
(SE of the line above: ESS/n ± 0.0052, ESS ± 52.2 — delta method on (mean w)^2 / mean w^2 from the same n = 10,000 weights; at mu >= 2 the weights are heavy-tailed and this SE is itself unreliable, cf. §48)
(a) IS, target N(3.0,1) from N(0,1), n=10,000: ESS = 46.9, ESS/n = 0.0047 (theory limit E[w]^2/E[w^2] = exp(-mu^2) = 0.0001; max weight share 0.0848)
(SE of the line above: ESS/n ± 0.0009, ESS ± 8.9 — delta method on (mean w)^2 / mean w^2 from the same n = 10,000 weights; at mu >= 2 the weights are heavy-tailed and this SE is itself unreliable, cf. §48)At a shift of the ten thousand draws are worth forty-seven, and the empirical ratio sits well above its limit because the weights that would pull it down have not yet been drawn — the heavy-tail problem in one number. §9.1 uses a quantity with the same name for a Markov chain, , which is a statement about autocorrelation, not about weights; the two are different objects, and neither guarantees a valid interval under heavy tails or poor mixing.
What the ESS does not measure. The weights alone do not fix the uncertainty of a particular estimate, because that depends on the integrand. Plain importance sampling, , has exactly; the self-normalised form has asymptotic variance by the delta method, with . Both carry ; does not. §48 computes all three bars in the §36 setting at the shift of , for , and two limiting cases:
§48 Weight-based IS ESS is not a standard error: the §36 setting at mu = 2 (target N(2,1), proposal N(0,1), f(x) = x, n = 10,000), closed-form IS and SNIS standard errors against sqrt(Var_p f / ESS)
(a) closed forms, from E[g(X) e^(aX)] = e^(a^2/2) E[g(X + a)] for X ~ N(0,1): Var_q(w f) = e^(mu^2)(1 + 4 mu^2) - mu^2 = 17 e^4 - 4 = 924.2; IS SE = sqrt(924.2/n) = 0.3040
(a) SNIS asymptotic variance E_q[w^2 (f - mu)^2]/(E_q w)^2 = e^(mu^2)(1 + mu^2) = 5 e^4 = 273.0; SNIS SE = sqrt(273.0/n) = 0.1652
(a) quadrature check on the §32 grid: Var_q(w f) = 924.2, E_q[w^2 (f - mu)^2] = 273.0, E_q[w^2] = 54.60 (e^(mu^2) = 54.60)
(b) weight-based bar sqrt(Var_p f / ESS), Var_p f = 1: §36's sample ESS on its own draw = 325.1 -> sqrt(1/325.1) = 0.0555; population ESS n/E_q[w^2] = n e^(-mu^2) = 183.2 -> 0.0739
(b) understatement: IS SE / bar = 5.48x (sample ESS 325.1), 4.11x (population ESS 183.2); SNIS SE / bar = 2.98x, 2.24x
(b) from §36's single draw: IS estimate 1.9026, draw-based SE sd(w_i f_i)/sqrt(n) = 0.1724; SNIS estimate 1.9647, delta-method SE sqrt(sum wn_i^2 (f_i - SNIS)^2) = 0.0738 (truth mu = 2.0)
(c) IS , R = 2,000 replications of n = 10,000: mean 1.9950 (truth 2.0, MC SE 0.0058), empirical SD 0.2577 vs closed-form SE 0.3040 (ratio 0.848)
(c) SNIS, R = 2,000 replications of n = 10,000: mean 1.9886 (truth 2.0, MC SE 0.0027), empirical SD 0.1196 vs closed-form SE 0.1652 (ratio 0.724)
(c) why the empirical SDs sit below the closed forms: the IS estimate's exact excess kurtosis is kappa_4(w f)/(n Var^2) = 13904, so an SD over R = 2,000 replications has relative SE ~ (1/2) sqrt((kappa + 2)/R) = 1.3 — the variance is carried by draws (x near 2 mu = 4 and beyond under q) that a few million samples rarely contain
(c) sample ESS across the 2,000 replications: median 325.3, 5th-95th pct 102.6-525.9, fraction above the population 183.2 = 0.8360 — the sample ESS overstates n e^(-mu^2) because the weights that would pull it down are rarely drawn
(d) limiting case f = 1: the SNIS estimate sum w_i / sum w_i equals 1 in every one of the 2,000 replications (max |est - 1| = 0.0e+00) whatever the ESS (13.0 to 721.6)
(e) p = q, every w_i = 1, ESS = n = 1,000 exactly; f(x) = tan(pi(Phi(x) - 1/2)) ~ Cauchy, Var_p f = infinity: IQR of the 2,000 replicated sample means = 2.175 (median -0.004; exact: the mean of n Cauchy draws is Cauchy, IQR 2 at every n; MC SE of the IQR at R = 2,000: 0.070)
(e) p = q, every w_i = 1, ESS = n = 10,000 exactly; f(x) = tan(pi(Phi(x) - 1/2)) ~ Cauchy, Var_p f = infinity: IQR of the 2,000 replicated sample means = 2.046 (median +0.073; exact: the mean of n Cauchy draws is Cauchy, IQR 2 at every n; MC SE of the IQR at R = 2,000: 0.070)
(e) IQR ratio n = 1,000 : 10,000 = 1.063 (a 1/sqrt(n) CLT bar would shrink it by sqrt(10) = 3.162): weights blameless, no bar at allAt and the plain estimate's standard error is — in closed form , from for standard normal — and the self-normalised estimate's is (). The bar one would compute from the weights, , understates the first by and the second by . The is the sample ESS of §36's draw; the population value gives a bar of , still too small by and .
The block's replications carry a warning of their own. Over repetitions the two estimates' empirical standard deviations are and , below the closed forms, and the draw-based standard error from §36's single sample is : the variance lives in proposal draws near that even twenty million samples rarely contain, the same reason the sample ESS sits above its limit in of replications.
With an excess kurtosis of for one estimate, a standard deviation from replications has a relative error near and can neither confirm the closed form nor refute it. So a draw-based bar is the right form but inherits the under-sampling at a shift this large — the case for the refusal rule in the box below, not against it. L1 for the closed forms; the replicated values are the §48 measurement.
Two limiting cases close the argument. With the self-normalised estimate is exactly , with no error, whatever the ESS. With every weight is and , yet an with infinite variance under has no CLT bar at all — the heavy-tail case of §6.4, with the weights blameless. L1 for both variance formulas (the self-normalised one asymptotic).
Action changed — the ESS correction. Report beside whenever an importance-weighted estimate is reported, and with it the largest single weight's share of the total, as the §36 block does — both diagnostics of the proposal, not of any estimate. The uncertainty of a particular estimate is computed from the draws: the sample variance of over for plain importance sampling, the delta-method form above for the self-normalised estimate. Weight-based ESS alone is not a valid confidence-interval denominator — at the shift of it understates the true bar by and (§48), and at that shift even the draw-based bar runs low. Refuse an estimate whose is tiny — at the shift of above it is , with one draw holding of the total weight — rather than quoting its mean with any error bar: the number is governed by weights not yet drawn, and the next draw can move it by more than the interval. Change the proposal, or the parametrisation, instead. §9.1's chain ESS is a different object with the same caveat.
3.5 Jensen, and the one inequality under every variational bound
For convex and integrable , , with equality for strictly convex if and only if is a.s. constant. With :
§19 E[log X] vs log E[X], X lognormal(0, s^2): s=0.1: gap 0.0050 s=0.5: gap 0.1250 s=1.0: gap 0.5000 s=2.0: gap 2.0000 natsThe evidence lower bound is this inequality applied to under : . The step that needs a hypothesis is not Jensen's but the one before it, : a change of measure (§2.2, §3.4), it is an equality only when — in general , so that holds whatever the supports, and the support condition decides whether the first inequality is tight, not whether the bound exists.
The one-line instance: two latent values with each and for both, so ; take and .
The principal identity is the KL decomposition, written in the order in which it is defined in every case:
The gap is exactly that KL; it is finite only if , and when it is the identity correctly returns — whereas the same identity read as would in that case say , which is undefined. The bound follows from a KL being non-negative, and it holds for the point mass above: and .
It is the same absolute-continuity discipline as §2.4, in both directions: Jensen's equality step needs the posterior absolutely continuous with respect to , the KL needs absolutely continuous with respect to the posterior, and a with a support smaller than the posterior's satisfies the second but not the first — so the decomposition gives the ELBO as a finite bound while the Jensen chain holds with its first inequality strict, and the two agree on the point mass above.
Half the variance of the log-ratio in the lognormal toy () is the stand-in for that KL. Our Information Domain piece's §6 split the ELBO into a distortion and a rate; the inequality that makes it a bound is this one, and the equality case says the bound is tight exactly when the ratio is constant, i.e. when is the posterior. L1.
Checkpoint exercise 3b. with and , the ReLU. Is the pathwise estimator of unbiased? What about ? And ? (ReLU: yes — is Lipschitz, so the difference quotients are bounded by , a dominating constant exists; the estimator is the true derivative. Indicator: no, §3.3. Absolute value: yes, same reason as ReLU; the kink is a null set and Lipschitz gives domination.)
4. Conditioning done right
4.1 From an event to a σ-algebra
The elementary definition needs and defines conditioning on an event. Every interesting case in machine learning conditions on a random variable (§1.6 glossary) — on the input , on the latent , on the history — and for a continuous every event has probability zero. §0's great circle showed that conditioning on a null event is not merely undefined but under-defined: different approximating families can give different answers (§4.4 says exactly when they cannot). Kolmogorov's resolution is to condition on a σ-algebra (§1.6 glossary) rather than on an event.
Definition. Let be integrable and a sub-σ-algebra. The conditional expectation (§1.6 glossary) is the (a.s. unique) random variable such that
- is -measurable — it is a function of the information in , and nothing else;
- for every — on every question can ask, and have the same average.
Existence is the Radon–Nikodym theorem of §2.2 applied to the measures on (sample space : §1.6 glossary; one for each of and ), each of which is absolutely continuous (§1.6 glossary) with respect to restricted to . Uniqueness up to a null set is the "a.e. unique" of the same theorem. means , and by Doob–Dynkin (§1.3) it is for a Borel — the regression function. Conditional probability is the special case .
Two properties that every derivation in this piece uses: the tower property for (coarser information wins; in particular ), and taking out what is known: when is -measurable and is integrable (e.g. bounded).
4.2 The projection theorem, and the one result a practitioner uses every day
Fast path · stop 6 of 14. Next stop: §5.1. This section's numbers run in
02_fast_path.ipynb.
When has finite variance, the definition says something geometric. The square-integrable random variables form a Hilbert space with inner product ; the -measurable ones form a closed subspace . Condition 2 of the definition, for , is equivalent to for every bounded -measurable — the residual is orthogonal to the subspace. Hence:
Theorem. For , is the orthogonal projection of onto . Consequently, for every -measurable with finite variance,
Read with and any predictor: the mean-squared-error-optimal predictor of from is the conditional mean , and the excess MSE of any other predictor is exactly its squared distance to the conditional mean. That is an exact theorem — L1 — and it is the content of every "the model learns " claim, with its restriction attached: the claim is about the population minimiser over all measurable functions. A finite model class trained on finite data minimises an empirical average over a hypothesis class — a subset of , not a linear subspace of it, since a ReLU family is not closed under addition — and its distance to the regression function has two parts — approximation (the class does not contain ) and estimation (the data do not identify the best element of the class) — to which a trained model adds a third, optimisation (the optimiser did not find the empirical minimiser); the display after the block keeps them apart. Here is the theorem with the projection made visible on a case where the regression function is known:
§5 Y = X^2 + sin 3X + noise(sd 0.5), X ~ N(0,1), n = 10^6
E[(Y - E[Y|X]) * X ] = -0.0002
E[(Y - E[Y|X]) * X^2 ] = +0.0003
E[(Y - E[Y|X]) * sin 3X ] = -0.0001
E[(Y - E[Y|X]) * 1[X>0] ] = -0.0004
MSE of best LINEAR predictor = 2.7392
MSE of E[Y|X] = 0.2497 (= noise variance 0.25)
E[(E[Y|X] - linear)^2] = 2.4885 -> sum 2.7382 (Pythagoras)The residual is orthogonal to every function of tried, including a non-linear and a discontinuous one; the linear predictor's MSE decomposes to within Monte Carlo error into the irreducible noise and the squared approximation gap. Nothing was fitted to produce the orthogonality — it is a property of the conditional mean, not of a training procedure.
Three statements of increasing scope, which should be kept apart. Pointwise: at each , the constant that minimises is . Orthogonality: the residual is orthogonal to every square-integrable function of — the block above. Excess risk over a class: writing and , the theorem's second line is
and for a model trained on points from a class with population-best element and empirical minimiser of the training risk ,
the three-way split of Bottou & Bousquet (2008). The first term is a property of the class and the regression function, and no amount of data moves it; the second is what §7's uniform laws bound, and it falls with ; the third is the population-risk effect of not reaching the empirical minimiser, and it is the remainder of an identity, not a loss: minimises the training risk, not , so has either sign — a model stopped short of the empirical minimiser can have lower population risk than that minimiser. The quantity that is non-negative by construction is the empirical optimisation gap
which measures how far the optimiser is from the training optimum and which the optimiser aims to reduce — non-negative by construction, but not monotone along an SGD trajectory (§8.4 shows the oscillation), so a monotone decrease needs conditions SGD does not satisfy; whether reducing it lowers is a separate question, and early stopping is the practice built on its answer being "not always" — a lower training loss is a better empirical minimiser, not a better predictor. The orthogonality statement is L1 and holds for every ; the split is L1 as an identity, and the work is in attributing a measured plateau to the right term, which includes not reading the third term's sign off the training curve.
From the square to any proper score: calibration and sharpness. The theorem is the square-loss case of a statement about scoring rules. Let take values in a finite set (the classification case; the continuous one is the same with densities), let be the conditional law, and let a model report a distribution rather than a point. A scoring rule is the loss charged when was reported and occurred; its expected value when is . The rule is proper if reporting the truth is optimal, for every , and strictly proper if equality forces . Gneiting & Raftery (2007), Theorem 1, characterise them: is proper iff is concave and the excess is a generalised Bregman divergence of the convex function — the generalised entropy of the score — with a subgradient in place of the gradient where has a kink (the log-loss and the Brier score have a differentiable and are unaffected).
Two cases carry machine learning. The log-loss has the Shannon entropy and (Gibbs' inequality); the Brier score has and . Both are strictly proper.
The population statement is the theorem's generalisation, and its proof is the tower property: for any measurable report , condition on and apply the pointwise inequality at each ,
so the population minimiser of a strictly proper score over all measurable reports is the conditional distribution , and the excess score of any other report is its expected divergence from — for the log-loss, for the Brier, exactly as for the square. L1. (The square loss on a real is itself a proper scoring rule for the mean: is minimised by and by nothing else about , which is why it identifies the conditional mean and no other feature of the conditional law.)
For a binary and a report , the Brier score splits once more along the same geometry — written now in its binary form , which is half the two-class sum above, since ; both conventions are proper, and the decomposition below holds up to that factor of two. Let be the calibration function — the frequency with which the event occurs among the cases where the model said . Since , the cross term vanishes (the orthogonality above with ), and
the calibration–refinement decomposition of Murphy (1973). The first term is zero iff the model is calibrated, : when it says , the event happens of the time. The second is , the noise left once the report is known; by the law of total variance below it equals , so it is small exactly when the calibrated forecasts are spread out — sharp.
Recalibration cannot buy sharpness. The canonical recalibration leaves the refinement term exactly where it is: on each level set of the event frequency is already , so is itself calibrated and is the refinement of both reports; any injective transform of (a temperature on the logits) leaves it alone for the same reason. A recalibration that discards information can never lower it and in general raises it: a calibrated , equiprobable, has refinement , while the constant report is also calibrated — the event happens half the time — and has refinement . Coarsening kept calibration and destroyed sharpness. L1 (exact arithmetic; §49 checks both numbers and repeats them on a simulated sample):
§49 Recalibration cannot buy sharpness: the calibration-refinement split of the Brier score for a calibrated two-level report, the constant 0.5, and the canonical recalibration of a miscalibrated report
(a) exact, Q uniform on {0.2, 0.8}, Y ~ Bernoulli(Q): Brier = calibration E[(q - c(q))^2] + refinement E[c(q)(1 - c(q))]
(a) Q itself, calibrated : calibration 0.0000 refinement 0.1600 Brier 0.1600
(a) constant 0.5, calibrated : calibration 0.0000 refinement 0.2500 Brier 0.2500
(a) q = 0.3 / 0.9, miscalibrated: calibration 0.0100 refinement 0.1600 Brier 0.1700
(a) its recalibration c(q) : calibration 0.0000 refinement 0.1600 Brier 0.1600
(b) simulated N = 200,000: level Q = 0.2: 99,708 cases, empirical c = 0.2004 (SE 0.0013)
(b) simulated N = 200,000: level Q = 0.8: 100,292 cases, empirical c = 0.7998 (SE 0.0013)
(b) Q itself : calibration 8.20e-08 (sampling floor sum_l c_l(1 - c_l)/N = 1.6e-06) refinement 0.1602 (SE 0.0005) Brier 0.1602 (SE 0.0005)
(b) constant 0.5: calibration 9.12e-07 (sampling floor sum_l c_l(1 - c_l)/N = 1.2e-06) refinement 0.2500 (SE 0.0000) Brier 0.2500 (SE 0.0000)
(c) miscalibrated q = 0.3 / 0.9 on the same N = 200,000: calibration 0.0100 refinement 0.1602 (SE 0.0005) Brier 0.1701 (SE 0.0006) (exact 0.0100 / 0.1600 / 0.1700)
(c) canonical recalibration c(q), c estimated in-sample: levels [0.2004, 0.7998]; calibration 0.0e+00 refinement 0.1602 (equal to q's: True) Brier 0.1602 (SE 0.0005)
(c) held out (c fitted on the first 100,000, scored on the other 100,000): c = {0.3: 0.2001, 0.9: 0.8014}; q: calibration 0.0101, refinement 0.1607, Brier 0.1708; c(q): calibration 5.2e-06 (sampling-noise expectation sum_l c_l(1 - c_l)(1/h + 1/(N - h)) = 6.4e-06), refinement 0.1607, Brier 0.1607 (SE 0.0008)
(c) recalibration moved the calibration term 0.0101 -> 5.2e-06 and left the refinement at 0.1607 = 0.1607; coarsening Q to the constant 0.5 instead keeps calibration and raises refinement 0.16 -> 0.25The population minimiser is calibrated, by the tower property: . That is L1, and it is a statement about the optimum. "The model is calibrated" is a statement about a trained ; it is L3, and it is false often enough to have to be checked: Guo et al. (2017) measured modern networks trained to low log-loss and found them systematically over-confident, with a one-parameter temperature on the logits removing most of the gap — a repair of the first term that leaves the second, and the ranking of examples, untouched. A reliability diagram is an estimate of from binned data, with its own error bar (§7); §4.3 reads the same decomposition for the 0–1 loss and the pinball loss.
The law of total variance is the same decomposition read with : . With the σ-algebra of the model parameters it is the aleatoric/epistemic split our uncertainty piece used: the first term is noise the data carry at fixed parameters, the second is how much the prediction moves as the parameters do. At a fixed input , after seeing data , it reads
where the inner conditioning is on (the parameters, with held fixed) and the outer average and variance are over the posterior law of given — that is the σ-algebra choice the names depend on. A deep ensemble or a variational BNN is an approximation to that parameter law, and its epistemic term inherits the approximation's error: the decomposition is L1 as an identity, L2 once an approximate posterior is put in the place of , and L3 for any particular approximation's claim to be close. The split is L1; the names are a convention about which σ-algebra you chose to condition on, and a different choice gives a different split.
Read as a recipe, the display is what every practical uncertainty estimate computes, and the grading says what each is entitled to claim. The inner term, , is the aleatoric part — the model's own noise at fixed weights, a predicted variance or a softmax's spread, averaged over the weights; the outer term, , is the epistemic part — how far the mean prediction moves as the weights move under the posterior, zero where the data have pinned the weights and large where they have not.
A deep ensemble (Lakshminarayanan et al. 2017) trains networks from independent initialisations and reports the sample variance of their mean predictions as the outer term and the average of their predicted variances as the inner: a plug-in for the two terms, with the ensemble's spread in the place of the posterior law of . It makes no posterior claim, and we grade it L3 — the identity holds for whatever law the members have, but nothing says that law is , and an ensemble's outer term is the spread of an optimiser's endpoints, not a posterior variance.
A variational BNN puts a tractable in the place of and chooses by the §3.5 ELBO written on the weights, ; the display is then exact under , and the distance to the posterior is the KL the bound leaves unaccounted for — L2. The route that needs none of this is conformal prediction (§11.2): a set with guaranteed marginal coverage from exchangeability alone, at the price of not splitting its width into the two terms at all; §11.2 sets these beside split conformal as three ways to a distribution over predictions, each with its own assumptions.
Theorem card — the conditional mean as the MSE optimum. Object: , the σ-algebra , and the predictor class "all measurable functions of ". Theorem: is the orthogonal projection of onto , and for every . Guarantee does not apply when: has infinite variance (no projection); the loss is not the square — the log-loss and the pinball loss have other population minimisers (§4.3); or the claim is carried from the population minimiser over all functions to a finite class trained on finite data, where the approximation, estimation and optimisation terms appear. Counterexample: Cauchy (§5.2, §6.4) — , is undefined and every predictor has infinite MSE, so there is no projection; and under the pinball loss the population minimiser is the conditional -quantile, not the mean (§4.3) — for that loss the conclusion is false, not merely unproved. Action: before saying "the model learns ", state the loss it was trained with, and attribute a plateau to one term of the split — the theorem names the target, not the distance from it.
4.3 Classification: the Bayes classifier and its risk on E2, with a learning curve against it
For a label and the 0–1 loss, the same conditioning logic — now a pointwise arg-min rather than a projection — gives the Bayes classifier , equivalently , and the Bayes risk with : no measurable classifier does better, and the excess risk of any is . On E2 — class means , identity covariance, equal priors — the posterior is logistic in , the Bayes classifier is , and the Bayes risk is (the logistic rows below are scored on a held-out set of points — the drawn minus the first , which are the training pool):
§4 mu = 0.5: Bayes risk Phi(-mu) = 0.3085
mu = 1.0: Bayes risk Phi(-mu) = 0.1587
mu = 1.5: Bayes risk Phi(-mu) = 0.0668
mu = 2.0: Bayes risk Phi(-mu) = 0.0228
Monte Carlo Bayes classifier error at mu=1, d=20, n=200,000: 0.1586
logistic regression, n_train= 50, d=20: held-out error 0.2551 (excess over Bayes +0.0965)
logistic regression, n_train= 200, d=20: held-out error 0.1920 (excess over Bayes +0.0334)
logistic regression, n_train= 2000, d=20: held-out error 0.1629 (excess over Bayes +0.0042)
logistic regression, n_train= 20000, d=20: held-out error 0.1581 (excess over Bayes -0.0005)Logistic regression's model class contains the Bayes classifier here, so its approximation error is zero and the whole excess is estimation error. The single run above shows the shape — is only a factor , from to where is a few times and no rate has set in, while is a factor of about , and by it is within the held-out set's own unpaired noise of the floor ( at points — the single run's held-out set; the twenty-run replication below scores on one of ), which is a weaker reading than the paired one §46 gives below, since a model and the Bayes classifier scored on the same points disagree on few of them — but one learning curve is an illustration, not a rate law: each of its points is one draw of the training set. Here is the same curve over twenty independent training sets per , with a held-out set of points drawn once:
§38 held-out set: 100,000 points drawn once; Bayes classifier error on it 0.1596 (theory Phi(-1) = 0.1587)
n_train= 50, d=20, 20 reps: mean held-out error 0.2535, mean excess over Bayes Phi(-1) +0.0948, SE of the mean excess 0.0081 (min 0.2099, max 0.3431; excess over the held-out set's own Bayes error 0.1596: +0.0939)
n_train= 200, d=20, 20 reps: mean held-out error 0.1888, mean excess over Bayes Phi(-1) +0.0301, SE of the mean excess 0.0017 (min 0.1737, max 0.2053; excess over the held-out set's own Bayes error 0.1596: +0.0292)
n_train= 2000, d=20, 20 reps: mean held-out error 0.1623, mean excess over Bayes Phi(-1) +0.0037, SE of the mean excess 0.0002 (min 0.1612, max 0.1641; excess over the held-out set's own Bayes error 0.1596: +0.0027)
n_train= 20000, d=20, 20 reps: mean held-out error 0.1600, mean excess over Bayes Phi(-1) +0.0014, SE of the mean excess 0.0001 (min 0.1594, max 0.1605; excess over the held-out set's own Bayes error 0.1596: +0.0004)
excess(50)/excess(200) = 3.15 against Phi(-1), 3.22 against the held-out set's Bayes error (n ratio 4: a 1/sqrt(n) rate predicts sqrt(4) = 2.00, a d/n rate predicts 4)
excess(200)/excess(2000) = 8.23 against Phi(-1), 10.75 against the held-out set's Bayes error (n ratio 10: a 1/sqrt(n) rate predicts sqrt(10) = 3.16, a d/n rate predicts 10)
excess(2000)/excess(20000) = 2.68 against Phi(-1), 6.47 against the held-out set's Bayes error (n ratio 10: a 1/sqrt(n) rate predicts sqrt(10) = 3.16, a d/n rate predicts 10)Read with the error bars, the rate law is visible where it is entitled to be and absent where it is not. The spread across training sets at ( to held-out error) says that any single run at that size is a draw, not a measurement; the standard error of the mean excess is , and the first ratio, against or against the held-out set's own Bayes error, sits between the of a rate and the of — no rate has set in. The decade from to gives against and against the held-out Bayes error, the of , the parametric fast rate that a well-specified class and a margin condition buy, and faster than the worst-case shape §7 derives ( per decade). The last decade shows why the reference matters: against the ratio is only , because at the mean excess (across-seed SE — the spread of twenty models scored on one set, which does not contain that set's own sampling error) is mostly the held-out set's own offset from (, within its sampling noise ); against the set's own Bayes error the excess is (same across-seed SE ) and the ratio — the learner is still improving, and a -point evaluation set is what it takes to see it. A rate claim needs the repeated-seed curve, its error bars and a stated reference; the single run is the running example, not the evidence. Give the two classes different covariances, so that the Bayes boundary is quadratic and outside the logistic family, and a second, non-vanishing term appears. The decomposition is the first thing to compute when a model plateaus above a target: which floor is it sitting on? Our Information Domain piece asked that question for the cross-entropy (its §1 and Procedure 1); this is the same question for the 0–1 loss, and Fano's inequality (its §9.4) is the bridge between them — it lower-bounds by a function of , so a mutual-information estimate becomes a floor on accuracy.
Two uncertainties, and which number carries which. The twenty-seed block has one error bar, and it answers only one of the two questions a learning curve is asked. The across-seed standard error — of the twenty excess errors — measures how much the trained model varies with the draw of its training set. Because all twenty models are scored on the same points, the held-out set's own sampling error is one shared offset that every seed inherits and the across-seed spread cannot see; the above is that offset, and no number of seeds shrinks it.
The second uncertainty is the test-set one, and for the excess over the Bayes classifier it is a paired quantity: on the same points, the model and differ through the per-example difference , whose mean is the excess over the set's own Bayes error and whose standard error sits far below the unpaired , because the two classifiers agree on most points (Appendix C.2 and §7.6 are the same computation for two checkpoints). §46 reports both at , and then scores the same twenty models on a second, independent held-out set so that the shared offset is visible rather than inferred:
§46 held-out set 1: 100,000 points, its own Bayes-classifier error 0.1587 (population floor Phi(-1) = 0.1587); 20 seeds, each trained on n = 2,000, d = 20
(a) across 20 seeds on set 1: mean excess error over the set's Bayes error = +0.0028 (over Phi(-1): +0.0028); SD across seeds = 0.0009; SE of the mean = SD/sqrt(20) = 0.0002 (min +0.0012, max +0.0048)
(b) per seed, paired SE of the excess on set 1 = sqrt(Var(D_i)/100,000), D_i = 1{model wrong} - 1{Bayes wrong}: mean 0.00054, min 0.00043, max 0.00063 (vs the unpaired sqrt(2 * 0.16 * 0.84/n) = 0.00164)
(c) the SAME 20 models on an independent held-out set 2 (100,000 points, its own Bayes error 0.1580): mean excess over the set's Bayes error = +0.0034 (over Phi(-1): +0.0028); SD across seeds 0.0011
(c) shared-test-set offset between the two sets: mean excess set 1 - set 2 = -0.0006 (raw error +0.0000); per-seed correlation of excess across the two sets = 0.856 — compare with the across-seed SE 0.0002 and the paired SE ~0.00054Read across. The across-seed SE at is — twenty models trained on independent draws land within an SD of of one another — and that is a statement about the reproducibility of the procedure. The paired SE of any one model's excess on the -point set is about (between and across the seeds), a third of the unpaired that treats the model's error and the Bayes classifier's as independent counts: the two classifiers disagree on few points, and the paired bar is the one that says how well this model's excess on this set is known.
The second held-out set shows the offset neither bar contains: the same twenty models have the same mean raw error on both sets to four decimals, while the sets' own Bayes errors differ by ( against ), so the mean excess moves from to — a shift of , three across-seed SEs and of the order of the paired SE — and the per-seed excesses on the two sets are correlated at , because the models are the same and only the set changed. The §38 reading above stands with one qualification: the model at is near the floor as measured on that set, and "near the floor" is a paired statement about the per-example differences against , not one the across-seed bar can make. Report both bars, say which is which, and when the Bayes classifier is known, as it is here, compute the paired one.
Proper scoring rules, revisited. §4.2 stated the general theorem; here it is read for classification. Our earlier piece's §1.1 stated that the population minimiser of the cross-entropy is the conditional distribution . In this section's vocabulary that is the same conditioning logic with the log-loss in place of the square — a pointwise arg-min at each (Gibbs' inequality), not an projection: the minimiser over all measurable of is , and the excess is . The Brier score has the same minimiser , and its expectation splits exactly into a calibration (reliability) term, , which a reliability diagram estimates, and a refinement term that no recalibration of can remove — the calibration–refinement decomposition of Murphy (1973) and DeGroot & Fienberg (1983), displayed in §4.2. And the pinball loss has as its population minimiser the conditional -quantile of given , not the mean: the conditional mean is the optimum for one loss, not for prediction as such, and which conditional functional a model estimates is decided by the loss it was trained with. So "the model is calibrated" is L1 for the population minimiser and nothing for a trained model: calibration is a property the optimum has, and a model's distance from it is an empirical quantity with its own error bar (§7).
4.4 Regular conditional distributions, and the great circle resolved
is defined one at a time, up to a null set that depends on . To speak of "the conditional distribution of given " as a probability measure for each , one needs those null sets to be assembled consistently across uncountably many events. Theorem. If takes values in a standard Borel space (any space in this piece), there is a regular conditional distribution: a kernel that is a probability measure in for each , measurable in for each , with a.s. for every . This is what "" denotes when it is a measure rather than a density, and it is what a conditional generative model is a model of.
The resolution of §0's paradox is now one sentence: is unique only up to a null set of with respect to the law of (the pushforward, §1.6 glossary), and the value of that picks out the great circle is such a set. Two different random variables and that both "vanish on the great circle" — the latitude and the longitude — have different laws, different null sets and different kernels, and there is no theorem that their kernels agree on the one null set where you are asking. The latitude band and the longitude band are the two kernels; the numbers in §0 are what each returns.
What the paradox does not say is that every conditional law on a null event is ambiguous — and it does not say that singularity of the joint law is what makes one ambiguous. Two facts have to be kept apart. The first is the existence theorem above: the kernel exists, and is unique up to a -null set of , for every joint law on a standard Borel space. A joint density (a Radon–Nikodym derivative with respect to Lebesgue measure on the plane, §1.6 glossary) is not required, and a singular law has a regular conditional distribution exactly as a smooth one does.
The second is what singles out a version at one specific , and that is a regularity property of the kernel itself, not of the joint law: if lies in the support of — every neighbourhood of has positive -mass, so that neighbourhoods reached through exist at all — and is continuous at — weakly, for every bounded continuous — then for every family of neighbourhoods of reached through that shrinks to — with and — weakly; and in total variation if the kernel is continuous in total variation.
The proof is one line: is an average of over within of , and , so it is an average of measures that converge to and converges to it. The radius is what the hypothesis needs: a decreasing family with intersection alone can keep a distant piece whose conditional mass dominates, and the average then does not converge to . The support condition is what lets continuity determine anything: outside no neighbourhood of has positive probability, so there is nothing to condition on and no observable law to separate two continuous kernels that disagree there — with almost surely the kernel is pinned at , and two kernels continuous in that differ at are both versions, because puts no mass near . The canonical version at is , and every neighbourhood procedure in that shrinks to finds it. L1. (Without any continuity, a density still gives the limit at almost every , by Lebesgue differentiation — the a.e. of Radon–Nikodym again, which is no help at the one you are asking about.)
Both directions of the mistake are then visible. A singular law can have a perfectly canonical kernel. Take with uniform on : the joint law lives on the diagonal, , there is no joint density — and yet
because is weakly continuous (the restriction to is §5.5's portmanteau clause): conditioning on being near pins near , unambiguously, by any shrinking interval of .
Conversely, a continuous joint density is not by itself enough, because the continuity the theorem needs is the kernel's. If is continuous with , then is a version of , and it is the canonical one provided the marginal is continuous at : then pointwise in , both integrate to one, and Scheffé's lemma upgrades that to total-variation continuity of the kernel. Joint continuity of does not deliver the proviso on its own — can jump at if mass escapes to infinity in as (Fatou allows ), and then the neighbourhood limit of carries only the mass that did not escape and differs from . The certificate that it cannot is §3.2's domination, with integrable for near . Every density in this piece is bounded with a continuous marginal, so the proviso holds throughout; but what makes the version canonical is the kernel's regularity, and a density is one way of certifying it — neither the only way nor, on its own, a sufficient one.
Take jointly Gaussian with unit variances and correlation : at every , and conditioning on , or on , or on any other neighbourhood of reached through gives the same limit as . The great-circle ambiguity needed a second random variable: the latitude and the longitude are different 's, each with its own kernel, and the paradox is about conditioning on a lower-dimensional set reached through different random variables — not about a single with a regular kernel, which has one canonical version at every in the support of where it is regular.
The machine-learning consequence is narrower than the paradox suggests, and sharper for it. When a diffusion model is asked for for an exact observation of a continuous coordinate — inpainting with a hard mask, a constraint — two things are true at once. First, the model is a learned pushforward (§2.1): a measure on image space, concentrated near a low-dimensional set (§2.2), from which no kernel at the observed coordinates has been read off, let alone one checked for continuity in . Singularity by itself decides nothing — the law above is singular and has a canonical kernel at every point — but a canonical version is a property of the kernel's regularity, and the regularity of this pushforward's kernel at these coordinates is something you have not verified and in general cannot. So the target has to be stated: as an observation model with a noise level, or as a limit through a named family of events in .
Second, once the target is stated, replacement guidance (overwrite the observed pixels at each step, i.e. condition on a noisy band that shrinks with the noise schedule), classifier-free guidance on an encoded , or a likelihood term with a chosen noise level are different algorithms approximating it: the "same" conditioning can produce visibly different conditional laws depending on which one the method chose, without any bug, because they are different approximations of one stated target — not because the target is undefined. The rule is to write down the observation model: when you can show the kernel is continuous at the observed value — a continuous joint density with a continuous marginal is the usual certificate — that model is the canonical one; when you cannot, the family you shrink is a choice, and it has to be declared. L1 for "the kernel is defined only up to a -null set, and continuity of the kernel at an in the support of fixes the version there"; L3 for any claim about which target a given guidance method is implicitly approximating, which has to be derived case by case.
4.5 Bayes' theorem as a density ratio, and the on-ramp to inference
For a parameter with prior law and data with conditional law having density with respect to a common , the posterior is the regular conditional distribution of given , and its Radon–Nikodym derivative with respect to the prior is the normalised likelihood:
That is Bayes' theorem in the form that survives when the prior has no density — a prior with atoms, a prior on a function space, a Gaussian process. Two things follow and are developed in a forthcoming piece on Bayesian and non-parametric inference: the posterior is absolutely continuous with respect to the prior (a prior that gives a set zero mass can never be moved off zero by data — this is the formal content of "the prior must have full support"), and the denominator, the evidence, is the quantity whose logarithm our Information Domain piece's §11 called a description length. §11 of this piece says where the prior comes from.
Checkpoint exercise 4. On E2 with and , what is the Bayes risk, and what is the excess risk of the classifier ? (Bayes risk . The second classifier's margin is , whose class-conditional mean is , so its risk is and the excess is — adding one pure-noise coordinate to the decision rule costs more than the entire Bayes risk.)
Diagnostic exercise A. A colleague writes: "We condition our generative model on . Since , Borel–Kolmogorov says the conditional law is whatever our sampler makes it, so the fact that our two samplers disagree is not a bug." Here is jointly Gaussian with unit variances and correlation ; sampler 1 keeps draws with , sampler 2 keeps draws with , both with . Which versions of can differ, which cannot, and what selects one here? Diagnose the conclusion. (Versions of the kernel can differ only on a -null set of . The joint density is continuous and , so the canonical version is selected at itself, and every neighbourhood of shrinking through converges to it — sampler 1 is right in the limit. Sampler 2's band has a width that depends on : it is conditioning on the event , i.e. on a different random variable vanishing, and its limit is the canonical density reweighted by and renormalised — the great-circle mechanism, reproduced on purpose. The disagreement is real, but the conclusion is wrong twice: the target is not ambiguous, because a continuous density with a continuous marginal fixes it; and sampler 2 is not computing it, because it changed the conditioning variable. The fix is the one §4.4 states: write the observation model down, and check that each sampler's shrinking family is a neighbourhood of in , not in some function of .)
5. Four convergences, and which one your training loop is in
5.1 The definitions and the implication diagram
Fast path · stop 7 of 14. Next stop: §5.4. This section's numbers run in
02_fast_path.ipynb.
Let and be random variables on one probability space. The four modes of convergence (§1.6 glossary):
- Almost surely: — convergence happens for every outside a null set.
- In probability: for every .
- In (): .
- In distribution (weakly): for every bounded continuous ; equivalently at every continuity point of . This one needs no common space — it is a statement about laws.
The implications: a.s. in probability; in probability; in probability in distribution; and in probability a.s. along a subsequence. Nothing else holds in general — with two exceptions worth knowing: on a probability space for (Jensen), and convergence in distribution to a constant implies convergence in probability, which is why Slutsky's theorem in §5.5 may be stated with in place of in probability — and the two counter-examples that show it are both on E1's probability space, measured below on draws of :
§7 typewriter: P(X_n = 1) at n = 1, 3, 7, 1023, 4095: [1.0, 0.5014, 0.2523, 0.0021, 0.0006] -> 0
typewriter: fraction of sample points u hit at least once per dyadic level (12 levels): 1.0000 -> limsup X_n = 1 a.s.
(SE of the P(X_n = 1) line: each entry is a frequency over the 100,000 points u, ± sqrt(p(1-p)/100,000) = 0.0000, 0.0016, 0.0014, 0.0001, 0.0001; the 1.0000 is exact — every u is hit at every level)The typewriter sequence enumerates the dyadic intervals level by level and sets . at level , so in probability and in every . But at every level the intervals cover , so every is hit once per level — infinitely often — and for every : no almost-sure convergence. The subsequence that converges a.s. is, for instance, the first interval of each level. The escaping-mass sequence of §3.2 converges a.s. and in probability but not in . So:
The four modes against E1's two counter-examples, one row each — a definition in one clause, what each sequence does, and what the mode licenses:
| Mode | Definition | Typewriter | Escaping mass | What it certifies | What it does not |
|---|---|---|---|---|---|
| a.s. | ✗ — for every | ✓ — once | This run's sequence settles | That the expectation settles (escaping mass) | |
| in probability | for every | ✓ — | ✓ — | Each late term is probably close | That any single run settles (typewriter) |
| ✓ — | ✗ — | The average -th error vanishes (uniform integrability, §3.2, is what upgrades in-probability to ) | That any single run settles (typewriter) | ||
| in distribution | for every bounded continuous | ✓ — to | ✓ — to | The histogram settles | Anything about (independent copies converge in distribution to each other's law and never to each other) |
The typewriter is the one to keep in mind for training: a loss that is probably small at every late step is a different claim from a loss that eventually stays small, and the second is the one the word "converged" means. convergence — and so convergence in probability, by Markov's inequality (§7) — is what a per-step bound gives you, since ; almost-sure convergence of the loss and the gradient is what Robbins–Monro steps give you (§8); they are different theorems with different hypotheses.
5.2 The laws of large numbers, and what Monte Carlo is entitled to
For i.i.d. with and :
- Weak law: in probability. (With finite variance, Chebyshev proves it in one line: .)
- Strong law (Kolmogorov; Etemadi 1981 for pairwise independence): almost surely. Finite mean is necessary as well as sufficient: if then a.s.
A Monte Carlo estimate of is entitled to the strong law if — the estimate on your run converges — and to the central limit theorem of §6 for its error bar, , only if additionally ; §6.4's Pareto() lives in the gap between the two. It is entitled to neither if , and a sample mean does not announce when that is the case:
§11 Cauchy running mean at n = 10^2..10^6: [-1.135, -0.296, -0.331, -0.308, 0.022]
§30 St Petersburg sample mean of 2^K at n = 10^2..10^6: [11.1, 10.2, 10.7, 17.2, 25.0] (grows like log2(n) — Feller: S_n/(n log2 n) -> 1 in probability — and never settles)The Cauchy mean wanders forever — has the same Cauchy law for every — and the St Petersburg mean (payout after tosses to the first head, infinite expectation) drifts upward like — Feller's theorem that in probability — and the measured at against is that convergence being slow and only in probability, not a contradiction of it. Both look, at any single , like a noisy estimate of something. §12 gives the checklist for suspecting this; the short version is that a running mean that keeps jumping on single samples at is reporting a tail, not a value. Everything in this subsection assumed i.i.d. terms; for a dependent sequence — a Markov chain's samples, consecutive mini-batches, the tokens of one document — the strong law needs ergodicity in place of independence, and the variance in the error bar is the long-run variance of §9.1, not .
5.3 The empirical distribution: Glivenko–Cantelli and the first uniform law
The strong law is pointwise: for each fixed set , the empirical frequency a.s. Machine learning needs something uniform over a class of sets or functions, because the model selects from the class after seeing the data. The oldest such result:
Glivenko–Cantelli (1933). For i.i.d. real with distribution function and empirical distribution function , a.s.
Dvoretzky–Kiefer–Wolfowitz (1956; Massart's constant 1990). , for every .
§16 n= 100: sup|F_n - F| = 0.0697 DKW 95% bound = 0.1358
n= 1000: sup|F_n - F| = 0.0269 DKW 95% bound = 0.0429
n= 10000: sup|F_n - F| = 0.0074 DKW 95% bound = 0.0136
n= 100000: sup|F_n - F| = 0.0035 DKW 95% bound = 0.0043The remarkable part is the "for every ": the rate and the constant do not depend on the distribution — the class of half-lines is simple enough that uniform convergence is distribution-free. §7 is what happens when the class is a neural network's function class instead of the half-lines: the same shape of statement, with the class's complexity replacing the half-lines' simplicity, and the same appearing as the Hoeffding term.
5.4 The law of the iterated logarithm: the envelope a loss curve actually lives in
Fast path · stop 8 of 14. Next stop: §7.6. This section's numbers run in
02_fast_path.ipynb.
The central limit theorem (§6) says is of order at a fixed . It does not say the running mean stays within a few standard errors for all large at once — and it does not, by a specific factor:
Law of the iterated logarithm (Khinchin 1924; Hartman–Wintner 1941). For i.i.d. with mean and variance ,
and the is .
So the running mean's deviation from exceeds infinitely often and exceeds times it only finitely often. The envelope is wider than the CLT scale by — a slowly growing factor that is already at :
§8 fair coin, 2e6 flips, n in [100, 2e6]:
fraction of n with |S_n/n - 1/2| > LIL envelope : 0.00007
fraction of n with |S_n/n - 1/2| > 0.5 * envelope : 0.2615
fraction of n with |S_n/n - 1/2| > 1 CLT standard error: 0.3947
n= 100: envelope = 0.08738 CLT scale = 0.05000 ratio = 1.748
n= 10000: envelope = 0.01054 CLT scale = 0.00500 ratio = 2.107
n= 1000000: envelope = 0.00115 CLT scale = 0.00050 ratio = 2.292On one run of two million fair coins, the running mean sat outside one standard error at of all times and outside the full LIL envelope at of them — the envelope is the thing it stays inside (any multiple of it, eventually, while crossing of it forever), the standard error is not. The consequence for anyone reading a monitored quantity over time is in §8 under optional stopping; stated here without the machinery: a running average of a stream of i.i.d. terms — a Monte Carlo estimate as its samples accumulate, a streaming estimate of any mean on fresh draws — will cross any band of width infinitely often, for every , so "stop the first time the curve enters the band" — a stopping time (§1.6 glossary) — is a rule that is guaranteed to fire on noise, and "pick the time with the best value" selects a -sized excursion by construction.
A metric re-evaluated on a fixed validation set at successive checkpoints is a different object: its sampling noise is one draw shared by every checkpoint, not fresh terms arriving in , and the bias of picking the best checkpoint is the maximum over correlated estimates of §7.6, not a LIL excursion. The two live in different bars:
| Object | How the noise arrives | The bar it lives in | What "pick the best time" costs |
|---|---|---|---|
| Stream running mean (Monte Carlo as samples accumulate; a loss on fresh draws) | Fresh i.i.d. terms at every | The LIL envelope ; every band is crossed infinitely often | A -sized excursion (§8.2, optional stopping) |
| Fixed held-out set re-evaluated at checkpoints | One draw of sampling noise, shared by every checkpoint | The CLT bar at each checkpoint — the same draw each time | The maximum of correlated estimates (§7.6) |
Appendix C.2 puts the SGD curve of §8 inside its envelope — and, for the table's second row, gives the bar a fixed held-out set re-evaluated at checkpoints actually lives in: the paired standard error of the per-example difference between two checkpoints, computed from per-example predictions. For a fixed held-out set the right bar is C.2's, not the LIL's.
5.5 Weak convergence: the tools, and what the delta method is for
Three facts about convergence in distribution, used in §6 and §7:
- Portmanteau. iff for closed , iff for open , iff for every Borel whose boundary is -null. The last clause is why a histogram with bins whose edges the limit law does not charge converges, and why the probability of a half-open bin may not.
- Skorokhod's representation. If , there exist on some probability space with the same laws and a.s. This is the device that turns a statement about laws into a statement about sample paths when a proof needs one; it is also a reminder that weak convergence by itself says nothing about the coupling.
- Slutsky and the delta method. If and in probability then and . And if and is differentiable at with , then .
The delta method is the error bar for any metric that is a smooth function of averages — a ratio of two counts, an F1 score, the inverse geometric mean of per-token probabilities (perplexity) — and it is the theorem that says the error bar on -perplexity is the error bar on the mean log-loss, while the error bar on perplexity itself is that times the perplexity. Metrics that are not smooth functions of averages — a rank, a median, a BLEU with clipping at zero — are not covered and need a bootstrap, whose own validity needs regularity: it is valid for Hadamard-differentiable functionals (van der Vaart, Asymptotic Statistics, Ch. 23) and is justified by a uniform law of the §5.3 kind — a median, or any quantile, is covered when the density is positive at that quantile, which is what makes it Hadamard-differentiable; the maximum and other non-regular statistics are not. A maximum is not even that: for extremes the ordinary bootstrap is inconsistent (Bickel & Freedman 1981), and an -out-of- bootstrap or extreme-value theory is needed.
Checkpoint exercise 5. A per-token loss has standard deviation nats across tokens. At tokens, how wide is the one-standard-error band around the running mean, and how wide is the LIL envelope? If you declare convergence when the running mean first enters a band of half-width one standard error at the current , i.e. , will it later leave? And if the band is a fixed nats around the true mean? (Standard error . Envelope . The shrinking band: yes — the LIL says the deviation exceeds infinitely often, and that is wider than for every fixed once is large, so a band of half-width is left and re-entered without bound for every . The fixed band: no — the strong law says the running mean converges, so it leaves a fixed band of only finitely often and is eventually inside it for good. The excursions the LIL promises are on the scale that shrinks with ; a band that does not shrink is eventually never left.)
6. The central limit theorem is a Fourier theorem
Not on the fast path. The practical destinations — the eval error bar (§7.6) and the SGD claim (§8.4) — do not depend on this section; it supplies the ten-line proof behind the Gaussian shape of every error bar in the piece (§6.2), the rate that says when that shape is honest (§6.3), the heavy-tailed case where it is not (§6.4), and the infinite-width network as a central limit theorem (§6.6).
6.1 The characteristic function is the Fourier transform of a law
For a random variable with law , the characteristic function is
the Fourier transform of the measure — our frequency-domain piece with a probability measure in place of a signal. It always exists (the integrand is bounded), it is uniformly continuous, , , and three theorems make it the right tool:
- Uniqueness and inversion. determines ; if is integrable then has the continuous density .
- Independence becomes multiplication. If then . The law of a sum of independent variables is the convolution of their laws, and the Fourier transform turns convolution into a product — this is the convolution theorem of our frequency-domain piece, verbatim, and it is the reason sums are the natural object of probability.
- Lévy's continuity theorem. if and only if for every ; and if pointwise with continuous at , then is a characteristic function and converges in distribution to its law.
Our Bochner piece stated which functions are Fourier transforms of positive measures: the continuous positive-definite ones. Read here: the characteristic functions are exactly the continuous positive-definite with . So the shift-invariant kernels of that piece and the characteristic functions of this one are the same class of objects, normalised differently — a Gaussian kernel is the characteristic function of a Gaussian law, and a Laplacian kernel is the characteristic function of a Cauchy law. That identity is used again below: in §7, where random Fourier features are a Monte Carlo estimate of a characteristic function, and in §6.2 and §6.5, where the Gaussian's stability under convolution is read off its transform.
6.2 The theorem, in ten lines
Central limit theorem (Lindeberg–Lévy). For i.i.d. with mean and variance , .
Proof. Finite variance gives a two-term Taylor expansion of the characteristic function at zero, . By independence, , which is continuous at and is the characteristic function of . Lévy's continuity theorem finishes it.
That is the whole proof, and it explains the theorem rather than merely establishing it: convolution multiplies transforms; the -th power of anything that looks like near zero looks like ; the Gaussian is the law whose transform is exactly that shape, and it is therefore the fixed point. Here is the proof's central object measured:
§10 standardised sum of n = 50 exponentials, 200,000 replicates
t=0.5: |empirical cf| = 0.8823, Re = +0.8822, Im = -0.0050; exp(-t^2/2) = 0.8825
t=1.0: |empirical cf| = 0.6080, Re = +0.6073, Im = -0.0290; exp(-t^2/2) = 0.6065
t=2.0: |empirical cf| = 0.1441, Re = +0.1341, Im = -0.0527; exp(-t^2/2) = 0.1353
(SE of the three lines above, sd/sqrt(200,000) of cos(tZ) and sin(tZ): t=0.5: Re ± 0.0004, Im ± 0.0010; t=1.0: Re ± 0.0010, Im ± 0.0015; t=2.0: Re ± 0.0016, Im ± 0.0016 — the Im parts sit 5.1, 19.7, 33.4 SE from 0: at n = 50 the exponential sum is still skewed, which the next line measures)
skewness of standardised sum: 0.2994 (theory gamma1/sqrt(n) = 0.2828)
(SE of the line above: ± 0.0095, sd(Z^3)/sqrt(200,000))The imaginary part is the residue of the exponential's skewness, which the proof's absorbs and which decays as — visible in the skewness line, and the subject of the next subsection.
Two extensions, one in each direction. Lindeberg–Feller drops "identically distributed": a sum of independent, not necessarily identical, centred terms is asymptotically Gaussian provided no single term dominates — formally, for every , with , and then — which is the version that makes "a sum of many small independent effects is Gaussian" a theorem with a checkable hypothesis. And the multivariate CLT says a standardised sum of i.i.d. random vectors with covariance converges to , by the same proof with .
6.3 Berry–Esseen: the rate, and why a rare-event sum is far from Gaussian
The CLT is a limit statement. The rate is:
Berry–Esseen (1941–42; constant by Shevtsova 2011). With and the centred third absolute moment ,
The quantity that governs it is , the standardised third absolute moment, which is large for skewed summands. For Bernoulli() summands, , which grows like as :
§9 p=0.5 n= 30: measured sup|F_n - Phi| = 0.0722 Berry–Esseen bound = 0.0867 (rho/sigma^3 = 1.000)
p=0.1 n= 30: measured sup|F_n - Phi| = 0.1474 Berry–Esseen bound = 0.2369 (rho/sigma^3 = 2.733)
p=0.1 n= 300: measured sup|F_n - Phi| = 0.0484 Berry–Esseen bound = 0.0749 (rho/sigma^3 = 2.733)
p=0.01 n= 300: measured sup|F_n - Phi| = 0.1472 Berry–Esseen bound = 0.2701 (rho/sigma^3 = 9.851)Three hundred Bernoulli() trials are as far from Gaussian as thirty Bernoulli() trials: the CLT's clock runs in units of , not . (The bound is loose by a factor of to here — to ; the exact binomial is used for the measured column, so this is the theorem's slack and not sampling error.)
The practitioner's version: a mean of rare events — a per-example failure rate of , a per-token loss dominated by occasional very large values — needs on the order of times more samples than a symmetric quantity before a Gaussian error bar is honest. For a failure rate that factor is about , and the Gaussian approximation on examples is off by in distribution-function units in the measured column, with the theorem promising only — a nominal interval built with the true variance can miss by up to twice the sup-distance, one error at each end, and the Wald interval that plugs in does worse still at small , where on of runs and the interval collapses to a point. The exact binomial (Clopper–Pearson) interval costs nothing and does not have this problem; the Wilson interval is itself a normal approximation, to the score statistic rather than to , but its coverage stays close to nominal even at small (Brown, Cai & DasGupta 2001); §7 returns to both.
6.4 Where the CLT fails: stable laws and heavy-tailed noise
Drop the finite variance and the proof breaks at the Taylor expansion: for some is what the transform of a symmetric law with tail looks like (an asymmetric tail gives a complex , and for the mean must be subtracted first), and the same argument gives , the characteristic function of an -stable law, with the normalisation instead of . The Gaussian is the case and the Cauchy is (which is why of Cauchy variables is again Cauchy, §5.2). The Gnedenko–Kolmogorov theorem says these, and only these, are the possible limits of normalised i.i.d. sums.
§11 Pareto(alpha=1.5): sample means of blocks of 1000: mean 2.996 (theory 3.000), sd 1.772, max 227.7
(no standard error is printed for the line above: a block mean of Pareto(1.5) draws has infinite variance, so sd/sqrt(20,000) = 0.0125 is a statistic of these 20,000 blocks with no population value behind it — §53 shows how far it moves between batches)
excess kurtosis of the block means: 12930.89 (a Gaussian limit would give ~0; the limit is 1.5-stable)The Pareto() has a finite mean, so the strong law holds and the block means (blocks of ) average to — but their distribution is nowhere near Gaussian: one block in twenty thousand had a mean of , and the kurtosis is five orders of magnitude off. A Gaussian error bar on the mean of a thousand such samples is not merely loose; it is of the wrong shape, and no fixes it.
What a heavy tail does not forbid is a better estimator of the mean. Median-of-means splits the sample into blocks, averages each, and takes the median of the block means; with a finite variance it has sub-Gaussian deviations — with probability , with no higher moment assumed (Nemirovsky & Yudin 1983; Lugosi & Mendelson 2019, Found. Comput. Math.) — and so tolerates the tail that makes the sample mean's Gaussian bar wrong. The Pareto() case has infinite variance, outside that guarantee, so the comparison shows what the estimator buys and what it does not:
§39 Pareto(1.5), x_min=1: true mean alpha/(alpha-1) = 3.0000; n=10,000, 1,000 replications, median-of-means with 20 blocks of 500
sample mean : RMSE 0.2926, median |error| 0.1096, 99th pct |error| 0.7080 (bias = mean error -0.0167, max |error| 6.490)
median-of-means: RMSE 0.1880, median |error| 0.1688, 99th pct |error| 0.3412 (bias = mean error -0.1661, max |error| 0.396)The tail is tamed: the sample mean's worst error over a thousand replications is against median-of-means' , its 99th-percentile error against , its empirical RMSE over these replications against . The RMSE line carries a caveat the other two do not. A Pareto() has infinite variance, so the sample mean's population mean-squared error , and with it its population RMSE, is at every finite : the is a statistic of this one simulation, not an estimate of a finite quantity, and a fresh set of replications can print a very different one (the spread across twenty independent batches is printed in §53, quoted in §7.4). Median-of-means' is likewise the empirical RMSE of this run — its population RMSE is finite here, since the median of twenty block means has a far lighter tail than any one of them, but its sub-Gaussian guarantee needs the finite variance this law lacks. The practical comparison therefore rests on the median absolute error and the upper error quantiles, which are the quantities that exist for both estimators. The price is bias — block means of a right-skewed law are themselves right-skewed, their median sits below their mean, and median-of-means is biased by with a larger typical error ( median absolute error against the sample mean's ). With a finite variance the block means approach Gaussian, the bias shrinks and the sub-Gaussian bound holds; at the blocks of are still stable-law, not Gaussian, and the estimator trades a tail for a bias. It does not make the Gaussian error bar honest; it bounds the deviations in a way the sample mean's are not, and §7.1's inequalities say by how much when the variance is finite.
Whether the noise in a stochastic gradient is of this kind is an empirical question with a literature: Simsekli, Sagun & Gürbüzbalaban (2019) fit tail indices to gradient-noise norms in several deep networks and argue that the SGD iterates are then better modelled by a Lévy-driven process than a Brownian one, with consequences for which minima are reached. We grade that L3: the measurement of a tail index is real and the stable-law theory is exact, but the claim that the dynamics follow from it depends on independence and stationarity assumptions along the trajectory that the papers themselves flag. What is L1 is the negative statement: if the per-sample gradient has infinite variance, then gradient-noise error bars built on the CLT, and any argument that averages gradient noise at a rate in the batch size, do not apply.
6.5 Entropy, and the Gaussian as a fixed point twice over
Our Information Domain piece's §9.8 derived the Gaussian as the maximum-entropy law at fixed variance. The CLT gives a second characterisation: the Gaussian is the fixed point of "add an independent copy and rescale", because its transform is the only one of the form , and rescaled is itself. The two are connected by a theorem with a hypothesis: Barron (1986) showed that if the standardised sum has finite relative entropy to the Gaussian for some — , which requires it to have a density and, at unit variance, is the same as that density having finite differential entropy — then , so the differential entropy of the standardised sum converges to the Gaussian's: the CLT in relative entropy, a strictly stronger mode than weak convergence. Artstein, Ball, Barthe & Naor (2004) proved that this entropy, where it is defined, is monotone in .
The hypothesis is not decorative. For Bernoulli summands is supported on points for every , its law is not absolutely continuous with respect to Lebesgue measure (§2.4's support problem), and for every : weak convergence to the Gaussian holds — de Moivre–Laplace — and convergence in relative entropy never starts. So for sums whose standardised law has finite relative entropy to the Gaussian at some stage (a density is necessary for that, not sufficient) the CLT is literally an entropy increase, the second law for sums, and the Gaussian is the maximum-entropy endpoint approached monotonically. L1 for the theorem as stated with its hypothesis, and the cleanest bridge between the two pieces.
6.6 The infinite-width network is a CLT, and the attention scale is a variance
Take a one-hidden-layer network with all weights i.i.d. . At any fixed input , is a normalised sum of i.i.d. terms , each with mean zero and finite variance; at a fixed finite set of inputs, is a normalised sum of i.i.d. random vectors. The multivariate CLT therefore says the outputs converge in distribution, as , to a centred Gaussian with covariance , which for at angle is half the arc-cosine kernel of Cho & Saul (2009), whose normalisation carries a factor : :
§29 one hidden ReLU layer, two unit inputs at cos(theta) = 0.6, 20,000 draws of the weights
width= 10: var f(x1) = 0.4876 (theory 0.5000 = k(x1,x1)), cov(f(x1), f(x2)) = 0.3313 (arc-cos 0.3388), excess kurtosis +1.472
(SE of the line above, from the same 20,000 networks: var ± 0.0064; cov ± 0.0052 (sd of the products / sqrt n); the kurtosis SE at this width is §41's, not sqrt(24/n))
width= 100: var f(x1) = 0.4870 (theory 0.5000 = k(x1,x1)), cov(f(x1), f(x2)) = 0.3274 (arc-cos 0.3388), excess kurtosis +0.156
(SE of the line above, from the same 20,000 networks: var ± 0.0051; cov ± 0.0043 (sd of the products / sqrt n); the kurtosis SE at this width is §41's, not sqrt(24/n))
width= 1000: var f(x1) = 0.4968 (theory 0.5000 = k(x1,x1)), cov(f(x1), f(x2)) = 0.3376 (arc-cos 0.3388), excess kurtosis +0.016
(SE of the line above, from the same 20,000 networks: var ± 0.0050; cov ± 0.0042 (sd of the products / sqrt n); the kurtosis SE at this width is §41's, not sqrt(24/n))
width= 10000: var f(x1) = 0.4978 (theory 0.5000 = k(x1,x1)), cov(f(x1), f(x2)) = 0.3387 (arc-cos 0.3388), excess kurtosis +0.029
(SE of the line above, from the same 20,000 networks: var ± 0.0050; cov ± 0.0042 (sd of the products / sqrt n); the kurtosis SE at this width is §41's, not sqrt(24/n))The covariance matches the kernel at every width — it is an expectation, not a limit — and the shape of the law becomes Gaussian as the width grows, with the excess kurtosis falling from at ten units to within noise of zero at a thousand. That fall is exact, not a trend: each summand has and , so an excess kurtosis of ; fourth cumulants of independent terms add and scale with the fourth power of the coefficient, so under the normalisation the sum's fourth cumulant is times 's while its variance equals 's, and the width- output has excess kurtosis exactly — :
§32 E[ReLU(g)^2] = 0.5000 (theory 1/2), E[ReLU(g)^4] = 1.5000 (theory 3/2), E[v^4] = 3.0000 (theory 3)
Z = v*ReLU(g): E[Z^2] = 0.5000 (theory 1/2), E[Z^4] = 4.5000 (theory 9/2), excess kurtosis E[Z^4]/E[Z^2]^2 - 3 = 15.0000 (theory 15)
MC standard error of the sample excess kurtosis, 20,000 Gaussian replicates: sqrt(24/20000) = 0.0346
width= 10: theory 15/N = +1.5000 §29 measured +1.472 |measured - theory| / SE = 0.81
width= 100: theory 15/N = +0.1500 §29 measured +0.156 |measured - theory| / SE = 0.17
width= 1000: theory 15/N = +0.0150 §29 measured +0.016 |measured - theory| / SE = 0.03
width= 10000: theory 15/N = +0.0015 §29 measured +0.029 |measured - theory| / SE = 0.79The measured at is not a departure from the theorem — but the bar the §32 block puts on it is the Gaussian one, and at small width that is the wrong bar. The line is the standard error of the sample excess kurtosis of Gaussian replicates; at width , where the law is Gaussian to , it is the right bar, and is within one standard error of .
At width the output's own excess kurtosis is and its eighth moment is far from the Gaussian's, and the variance of the sample kurtosis — a ratio of the fourth to the squared second sample moment, whose delta-method variance involves moments up to the eighth — is larger than . §41 measures it directly, by replicating the §29 estimate times per width from an exact sampler of the same law (and, as a check on that sampler, and times from the §29 sampler itself at widths and ) and reporting the standard deviation of the replicates, with the Gaussian value and the reviewer's closed-form finite- formula beside it:
§41 (a) m = 20,000 samples per kurtosis estimate, R = 1000 replicated estimates per width (exact sampler); Gaussian SE sqrt(24/m) = 0.0346; reviewer's asymptotic SE sqrt((24 + 1080/N + 12810/N^2 + 32490/N^3)/m)
(b) width= 10: empirical SD of the estimate = 0.1198 (its own SE ~ SD/sqrt(2(R-1)) = 0.0027) vs (i) Gaussian 0.0346 (ii) reviewer 0.1210 [ratio emp/(ii) = 0.991]; mean of the 1000 estimates +1.4965 ± 0.0038 vs exact 15/N = +1.5000; direct §29 sampler (400 reps): SD 0.1199, mean +1.4987
(b) width= 100: empirical SD of the estimate = 0.0433 (its own SE ~ SD/sqrt(2(R-1)) = 0.0010) vs (i) Gaussian 0.0346 (ii) reviewer 0.0425 [ratio emp/(ii) = 1.019]; mean of the 1000 estimates +0.1472 ± 0.0014 vs exact 15/N = +0.1500; direct §29 sampler (100 reps): SD 0.0426, mean +0.1441
(b) width= 1000: empirical SD of the estimate = 0.0366 (its own SE ~ SD/sqrt(2(R-1)) = 0.0008) vs (i) Gaussian 0.0346 (ii) reviewer 0.0354 [ratio emp/(ii) = 1.033]; mean of the 1000 estimates +0.0161 ± 0.0012 vs exact 15/N = +0.0150
(b) width= 10000: empirical SD of the estimate = 0.0348 (its own SE ~ SD/sqrt(2(R-1)) = 0.0008) vs (i) Gaussian 0.0346 (ii) reviewer 0.0347 [ratio emp/(ii) = 1.002]; mean of the 1000 estimates +0.0015 ± 0.0011 vs exact 15/N = +0.0015The §41 column is the per-width standard error, and the closed-form finite- variance agrees with the replicated SD at every width (ratios to , within one to two of the SD's own standard error), so either may be used; we use the measured one. Re-reading the column of the §32 block with it in the place of , on the block's printed values: at width , where the block said ; at , ; at , ; at , . The Gaussian SE is right at width ( against ) and understates the bar at width by a factor of .
The conclusion survives the correction — every row is compatible with at its own bar, the width- row more comfortably than the §32 line claimed — and the correction is the point: a Monte Carlo standard error is a property of the law being sampled, and quoting the Gaussian one for a non-Gaussian law is the same mistake at fourth order that quoting for a heavy tail is at second (§6.4).
This is Neal (1994)'s observation, and with the same argument applied layer by layer (conditioning on the previous layer's outputs and using the CLT again — strictly, taking the widths to infinity one layer at a time, or using a CLT for exchangeable rather than independent summands, since at finite width the units of the next layer share the previous layer's randomness) it is the neural-network Gaussian process of Lee et al. (2018) and Matthews et al. (2018). Our Gaussian-process piece presented the GP as a model one chooses; this says a randomly initialised wide network is one, by the central limit theorem, with a kernel the architecture determines. L1 for the prior at initialisation.
The practical consequence, stated here and not only in the card below: initialisation specifies a GP prior — the NNGP kernel the architecture determines — and a prior is not yet a predictor. A GP prediction needs, in addition, an observation model (a noise variance, or noiseless interpolation) and Bayesian conditioning on the labelled data; the architecture alone specifies neither. Training is a different construction again: an infinitely wide network trained by gradient flow on the squared loss is governed by the neural tangent kernel (NTK, Jacot–Gabriel–Hongler 2018, below), a different kernel from the NNGP. These give two principled baselines, each named with the procedure it represents — NNGP regression, the architecture's prior kernel conditioned on the labels under a stated observation model, and NTK regression, the infinite-width gradient-flow limit under squared loss — and neither is a single predictor "implied by initialisation". Before claiming that a trained wide network learned a structure, compute both on the same data and report the gap to each; a kernel regression is the baseline, and zero is not.
Training is a different theorem, and the two should not be run together. (i) At initialisation the output is a GP — the CLT above, L1. (ii) Under gradient flow at infinite width, the neural tangent kernel of Jacot, Gabriel & Hongler (2018) is deterministic and constant in time — a law-of-large-numbers statement about the gradient features — so the function evolves linearly in its initial value; under squared loss that evolution is an affine map of the initial GP, and the trained function is therefore again Gaussian, with a kernel the NTK and the training set determine (Lee et al. 2019) — L1 in the limit, for that loss. (iii) For a cross-entropy or any other loss the trained output is a non-linear function of the initial GP and is not generically Gaussian even at infinite width; at finite width the deviations from the kernel regime are a research area; and feature-learning parametrisations (mean-field, P) leave it altogether. So we grade "a trained wide network is a GP" as L2 in sense (ii) only — exact in the limit under squared loss, a correspondence at any width you can run — and we grade the three parts separately: the prior L1, training L2, finite width L3.
Action changed: before claiming a wide network "learned" a structure, compute two named baselines on the same data — NNGP regression (the architecture's prior kernel, conditioned on the labels under a stated observation model) and NTK regression (the infinite-width gradient-flow limit under squared loss) — and report the gap to each; initialisation fixes the prior kernel, not a predictor, and the baseline is a kernel regression, not zero (Appendix D.1).
Theorem card — the infinite-width network as a Gaussian process (Action changed). Object: a network of width with i.i.d. weights at initialisation, evaluated at a finite set of inputs. Theorem: as the outputs are jointly Gaussian with the kernel the architecture determines (§29); for this one-layer ReLU case the excess kurtosis at width is exactly (§32); under gradient flow at infinite width and squared loss the trained function is again Gaussian (NTK). Guarantee does not apply when: the loss is not the square; the parametrisation learns features (mean-field, P); the weights are not i.i.d. (pretrained); or the next layer's units are exchangeable rather than independent at finite width (the layer-by-layer argument). Counterexample: at every finite width the conclusion is false, not merely unproved — the output's excess kurtosis is exactly (§32), so Gaussianity is a statement about the limit and not about any width you can run; the width- row, measured against , is that counterexample in numbers. Action: before claiming that a wide network "learned" a structure, compute two named baselines on the same data — NNGP regression, the architecture's prior kernel conditioned on the labels under a stated observation model, and NTK regression, the infinite-width gradient-flow limit under squared loss — and report the gap to each; initialisation specifies the prior kernel, not a predictor, and the baseline is a kernel regression, not zero (Appendix D.1 says it; this section now does too).
A smaller instance of the same bookkeeping is the in scaled dot-product attention. For with i.i.d. entries, is a sum of i.i.d. products with variance each (the block measures independent pairs per ):
§12 d= 16: dot-product sd 4.11 (sqrt d = 4.00)
d= 256: dot-product sd 16.57 (sqrt d = 16.00)
d= 4096: dot-product sd 64.54 (sqrt d = 64.00)Without the scale, logits of standard deviation at would put the softmax in its saturated regime from the first step, which is the footnote in Vaswani et al. (2017) made explicit: the scale is a variance computation, and by the CLT the scaled logits are approximately standard normal at initialisation. L1.
Checkpoint exercise 6a. are i.i.d. exponential with mean . Using , write of the standardised sum of terms and verify its limit. Then: the skewness of the standardised sum is ; at what is Berry–Esseen's bound below ? (The standardised sum has ; expanding gives . For the exponential, with , so the bound needs — the exponential's skew makes it a slow case.)
7. Concentration: the finite-sample CLT, and the geometry of high dimensions
7.1 The chain of inequalities, each one tightening the last
The CLT says what a sum looks like as . Concentration inequalities say how far a sum can be from its mean at the you have, with an explicit probability. They form a chain, and each link adds an assumption and removes a factor:
- Markov. . Uses only the mean; the weakest possible statement, and the one every other is derived from.
- Chebyshev. . Markov on . Polynomial tails; it is what proves the weak law.
- Chernoff. . Markov on , optimised over . Exponential tails, if the moment generating function exists; everything below is a Chernoff bound with a particular MGF estimate plugged in.
- Hoeffding (1963). For independent , . For -valued terms: — the same form as the DKW bound of §5.3, which for a single is exactly this inequality; that the constant survives the supremum over all is Massart's theorem, not a union bound.
- Sub-Gaussian variables. The class for which Hoeffding's shape holds without boundedness: is sub-Gaussian with parameter if , equivalently, up to absolute constants in , its tails are , equivalently its -th moments grow like — Vershynin (2018), Prop. 2.5.2 collects five equivalent conditions, and the sub-Gaussian norm is the one number that makes them one statement: is sub-Gaussian iff , and is up to an absolute constant. Bounded and Gaussian variables are sub-Gaussian; a sum of independent sub-Gaussians is sub-Gaussian with the parameters adding in quadrature, for centred terms, which is the "general Hoeffding".
- Sub-exponential variables and Bernstein. Products of sub-Gaussians (a squared Gaussian, a ) have heavier, exponential tails. The class is the sub-exponential one, with norm beside the norm above, and the product rule is why a sample variance, or the sample covariance of §7.4, is a sub-exponential sum whenever the data are sub-Gaussian. For such a sum the tail has Bernstein's shape (Vershynin (2018), Thm. 2.8.1): — Gaussian for small , exponential beyond it, which are the two regimes a tail actually has. The bounded-terms version is the one everyone quotes; Bernstein's inequality handles them and, crucially, is variance-aware: for , . When the variance is much smaller than the range allows, Bernstein beats Hoeffding by the ratio:
§31 Bernoulli(0.01), n = 10,000, delta = 0.05: Hoeffding half-width 0.0136; Bernstein half-width 0.0029; true sd 0.0010Hoeffding charges for the full range; Bernstein charges for and pays a term for the range. §31 plugs in the true variance, which a practitioner does not have; the usable forms are the empirical-Bernstein inequality (Maurer & Pontil 2009), which substitutes the sample variance at the cost of a larger term ( in place of ), or the Wilson interval for a rate. For a rare-event rate — a failure rate, a hallucination rate — the Hoeffding interval is five times too wide, and the gap only widens as the rate falls.
- McDiarmid (bounded differences, 1989). For a function of independent variables that changes by at most when the -th argument changes, . Hoeffding is the case mean. This is the inequality under uniform convergence (§7.4): the supremum over a function class of the empirical–population gap is a function of the sample with bounded differences . Its proof is a martingale argument, §8.3.
- Gaussian concentration (Tsirelson–Ibragimov–Sudakov, 1976). For and -Lipschitz, — independent of . A Lipschitz function of a high-dimensional Gaussian is as concentrated as a one-dimensional Gaussian, whatever the dimension. This single inequality is the source of everything in the next subsection.
7.2 The geometry of : norms, angles, and why dot products work at all
Apply Gaussian concentration to , which is -Lipschitz. , and a short argument gives , so (§12: draws per , and independent pairs for the cosine):
The Gaussian annulus. with sub-Gaussian tails — the standard deviation of the norm is about in every dimension (Vershynin, Thm. 3.1.1). All the mass of a high-dimensional Gaussian is in a thin shell of radius ; the density is largest at the origin and there is essentially nothing there.
§12 d= 16: ||g|| mean 3.962 sd 0.683 (sqrt d = 4.000, sd -> 1/sqrt2 = 0.707); cosine sd 0.2544 (1/sqrt d = 0.2500)
(SE of the line above: ||g|| mean ± 0.015, its sd ± 0.011; cosine sd ± 0.0052; dot-product sd ± 0.10 — from the same 2,000 vectors / 1,000 pairs, SE(sd) = sqrt((m4 - s^4)/n)/(2 s))
d= 256: ||g|| mean 15.982 sd 0.713 (sqrt d = 16.000, sd -> 1/sqrt2 = 0.707); cosine sd 0.0644 (1/sqrt d = 0.0625)
(SE of the line above: ||g|| mean ± 0.016, its sd ± 0.011; cosine sd ± 0.0014; dot-product sd ± 0.38 — from the same 2,000 vectors / 1,000 pairs, SE(sd) = sqrt((m4 - s^4)/n)/(2 s))
d= 4096: ||g|| mean 64.020 sd 0.707 (sqrt d = 64.000, sd -> 1/sqrt2 = 0.707); cosine sd 0.0157 (1/sqrt d = 0.0156)
(SE of the line above: ||g|| mean ± 0.016, its sd ± 0.011; cosine sd ± 0.0003; dot-product sd ± 1.44 — from the same 2,000 vectors / 1,000 pairs, SE(sd) = sqrt((m4 - s^4)/n)/(2 s))At a glance — every entry is an exact closed form or a line of the §12 block (measured values in brackets):
| norm concentrates at | SD of the norm, | cosine SD | picture | |
|---|---|---|---|---|
| () | () | a thick shell; directions far from orthogonal | ||
| () | () | a thin shell; directions nearly orthogonal | ||
| () | () | shell, not ball — radius , width ; all directions nearly orthogonal | ||
| any | , independent of | the three-dimensional picture — mass near the centre, a spread of angles — is wrong in every column |
And the cosine between two independent Gaussian vectors is : at , two random directions have cosine within — — about of the time, and within () about of the time. The consequences are not subtle:
- Random embeddings are nearly orthogonal, which is why a -dimensional space can hold a million distinguishable keys. A table of random keys in dimensions has pairwise cosines of size , so a query matches its own key with score and the others with score ; the union bound over keys says the worst spurious match is about , which at and is . That number — not an architecture — is why a -dimensional space can hold a million near-orthogonal directions; whether a trained embedding puts the right items on them — whether dot-product retrieval over it returns what it should — is a separate, empirical claim about that embedding, and the geometry does not make it. So two grades, one for the theorem and one for the claim that the ML object satisfies its hypotheses: the near-orthogonality of random directions is L1 (it is Gaussian concentration), and "trained embeddings are spread like random directions, and retrieval works because of it" is L3 until measured on the embedding in question. The same number is the quantitative content of "superposition" arguments about features in a residual stream (which we grade L2: the geometry is a theorem, the claim that a trained model uses it that way is an interpretation).
- "Nearest" loses meaning for random points. Any one pairwise distance between random Gaussian points concentrates at , and the maximum over all pairs among points adds a union-bound term, , so the ratio of nearest to farthest distance tends to one when — for a collection whose size is subexponential in the dimension, — not for one of size with a fixed , where the union-bound term is of the same order as the typical distance and the extreme-distance fluctuations stay a nonvanishing fraction of it — and not for an arbitrarily large one; a nearest-neighbour method in a high-dimensional space works only to the extent the data are not like that — the manifold hypothesis of §10 is the name for that extent.
Johnson–Lindenstrauss (1984). A random Gaussian projection scaled by preserves all pairwise distances among points to within a factor with high probability once — independent of . The proof is the Gaussian annulus applied to each difference vector plus a union bound:
§13 1,000 points in d=4096 projected to k dims
k= 64: distance ratio mean 0.9947, sd 0.0861, max distortion 0.4061 (theory sd ~ 1/sqrt(2k) = 0.0884)
(SE of the line above: ratio mean ± 0.0027, sd ± 0.0010 — delete-one-point jackknife over the 1,000 points, since the 499,500 pairs share points; the max distortion is an extreme value, no SE)
k= 256: distance ratio mean 0.9973, sd 0.0443, max distortion 0.2102 (theory sd ~ 1/sqrt(2k) = 0.0442)
(SE of the line above: ratio mean ± 0.0014, sd ± 0.0005 — delete-one-point jackknife over the 1,000 points, since the 499,500 pairs share points; the max distortion is an extreme value, no SE)
k= 1024: distance ratio mean 0.9990, sd 0.0217, max distortion 0.1116 (theory sd ~ 1/sqrt(2k) = 0.0221)
(SE of the line above: ratio mean ± 0.0007, sd ± 0.0002 — delete-one-point jackknife over the 1,000 points, since the 499,500 pairs share points; the max distortion is an extreme value, no SE)Each projected distance is times the original, with standard deviation ; the worst case over half a million pairs is about five standard deviations, as a union bound predicts. This is the theorem under random projections for approximate nearest neighbours, under sketching in attention approximations, and under the "random features" of the next subsection. L1.
7.3 Random Fourier features are Hoeffding on Bochner
Our Bochner piece wrote a shift-invariant kernel as for a probability measure , and Rahimi & Recht (2007) replaced the expectation by a Monte Carlo average over draws of : and . Each term is bounded in , so Hoeffding gives with probability for a fixed pair, and a covering argument extends it uniformly over a compact set:
§17 RBF kernel, 200 points in 8 dimensions
D= 100: max |K_approx - K| = 0.3831, rms = 0.1018 (1/sqrt D = 0.1000)
(SE of the line above: max ± 0.0439, rms ± 0.0016 — delete-one-group jackknife over 10 groups of 10 features; the 100 features are the iid draws, the 200 points are fixed)
D= 1000: max |K_approx - K| = 0.1311, rms = 0.0317 (1/sqrt D = 0.0316)
(SE of the line above: max ± 0.0131, rms ± 0.0004 — delete-one-group jackknife over 10 groups of 100 features; the 1,000 features are the iid draws, the 200 points are fixed)
D= 10000: max |K_approx - K| = 0.0391, rms = 0.0099 (1/sqrt D = 0.0100)
(SE of the line above: max ± 0.0051, rms ± 0.0002 — delete-one-group jackknife over 10 groups of 1,000 features; the 10,000 features are the iid draws, the 200 points are fixed)The root-mean-square error is to two digits ( against at ) — and it is rather than something smaller only because most of the pairs are far apart with , where a single feature's variance is ; at it is — the maximum over pairs is about four times that, and nothing about the method is specific to the RBF kernel: it is the characteristic function of §6.1, estimated by a sample mean, with its Hoeffding error bar. L1, and the point where the frequency-domain, kernel and probability pieces are one computation.
7.4 Covariance estimation: you need , and here is the constant
How many samples does a covariance matrix need? The sample covariance of i.i.d. vectors has operator-norm error governed by a matrix concentration inequality:
Vershynin (2018), Thm. 4.7.1. Let be a random vector in with and covariance , sub-Gaussian with constant in the sense that for every — each one-dimensional marginal has norm (§7.1) at most times its standard deviation. Then, for i.i.d. copies, with an absolute constant. The hypothesis is load-bearing: estimates the second-moment matrix , which is the covariance only when the mean is zero — a scalar has while almost surely, an error of against a bound that tends to zero — and with an unknown mean we centre by the sample mean, which costs one degree of freedom ( in place of ) and leaves the form of the bound unchanged. Every example in this section is centred: the vectors of the §14 block and the three-point law below. The is part of the theorem: for a Gaussian vector is itself an absolute constant — the ratio of a scalar Gaussian's norm to its standard deviation does not depend on the scale — so in the Gaussian case is absorbed into and the §14 block below, which is Gaussian, stands as printed; for a general sub-Gaussian law it is not absorbed, and dropping it makes the statement false.
One dimension shows why: let with probability each and with probability — mean , variance , bounded and therefore sub-Gaussian — yet at and the probability that all samples are zero is , so nine datasets in ten return , an error of , and no bound with a universal can hold. What repairs it is : for a bounded variable , so here , and does grow like (up to a logarithm — the atom at forces it), which is exactly the factor the all-zero datasets demand; this is what §7.1's norm is for — it prices how far a law's tails sit from its variance, and the covariance bound pays that price in full. §47 prints the fraction of all-zero datasets, the mean error, and at this (L1, exact arithmetic):
§47 The covariance bound needs K^2: a bounded, mean-0, variance-1 three-point law (eps = 1e-4) whose sample covariance is 0 in nine datasets of ten at n = 1,000, d = 1
(a) X = ±eps^(-1/2) = ±100.0 w.p. eps/2 each, 0 w.p. 1 - eps, eps = 0.0001: E X = 0, E X^2 = eps * eps^(-1) = 1.0000 [exact]; Sigma_hat = (1/n) sum X_i^2 = N/(n eps) with N ~ Bin(n, eps)
(b) exact P(all n = 1,000 samples zero) = (1 - eps)^n = 0.9048 -> Sigma_hat = 0, operator-norm error ||Sigma|| = 1, in that fraction of datasets
(b) simulated, R = 20,000 datasets of n = 1,000: fraction all-zero = 0.9014 (binomial SE sqrt(p(1-p)/R) = 0.0021; |sim - exact| / SE = 1.63)
(c) d = 1 operator-norm error |Sigma_hat - 1|: simulated mean over R = 20,000 = 1.8324 (SE 0.0185); exact E|N/(n eps) - 1| = sum_k P(N=k)|k/(n eps) - 1| = 1.8097 (= 2(1 - eps)^n = 1.8097, since E[N/(n eps)] = 1)
(c) constant-free Gaussian-type reference sqrt(d/n) + d/n at d = 1, n = 1,000 = 0.0326 -> the mean error is 55x it: no universal C can cover this law
(d) ||X||_psi2 = inf{t: E exp(X^2/t^2) <= 2}; E exp(X^2/t^2) = 1 - eps + eps exp(1/(eps t^2)) = 2 => K^2 = ||X||_psi2^2 = 1/(eps ln((1 + eps)/eps)) = 1085.7 (check: E exp(X^2/K^2) = 2.000000)
(d) the bounded-variable bound ||X||_psi2 <= ||X||_inf/sqrt(ln 2) gives K^2 <= 1/(eps ln 2) = 14427.0; K^2 (sqrt(d/n) + d/n) = 35.4 (C = 1), which does cover the mean error 1.8097
(d) for contrast, a standard Gaussian: E exp(g^2/t^2) = (1 - 2/t^2)^(-1/2) = 2 => K^2 = 8/3 = 2.6667 at every scale (absorbed into C)
(e) eps = 0.01: exact K^2 = 1/(eps ln((1+eps)/eps)) = 21.7 1/(eps ln(1/eps)) = 21.7 (ratio 0.9978) bound 1/(eps ln 2) = 144.3 (1 - eps)^n at n = 1,000 = 0.0000
(e) eps = 0.001: exact K^2 = 1/(eps ln((1+eps)/eps)) = 144.7 1/(eps ln(1/eps)) = 144.8 (ratio 0.9999) bound 1/(eps ln 2) = 1442.7 (1 - eps)^n at n = 1,000 = 0.3677
(e) eps = 0.0001: exact K^2 = 1/(eps ln((1+eps)/eps)) = 1085.7 1/(eps ln(1/eps)) = 1085.7 (ratio 1.0000) bound 1/(eps ln 2) = 14427.0 (1 - eps)^n at n = 1,000 = 0.9048The mean error is , not , and exactly : has mean , and whenever it is not zero it is at least , so the all-zero datasets alone fix . The exact , against the cruder ; with the bound covers the error, while the -free falls short by . For a standard Gaussian the same computation gives at every scale. L1.
Bridge: from scalar to matrix concentration. The matrix Bernstein inequality (Tropp 2012, Thm. 1.4 in its two-sided form) is §7.1's Bernstein for a sum of independent random matrices. Let be independent symmetric random matrices with and almost surely, and let be the matrix variance. Then
Term by term against §7.1: the operator norm in place of the absolute value, the matrix variance in place of , the same that turns the tail exponential at , and one new factor, — a union bound over the eigen-directions, costing in the deviation. The proof is Chernoff's with the matrix exponential, Lieb's concavity theorem standing in for the factorised MGF. L1: a theorem, with its hypotheses stated.
What it buys. The sample covariance is such a sum — — so for data of bounded norm matrix Bernstein gives Theorem 4.7.1's with an extra (Vershynin (2018), Thm. 5.6.1). The random-features Gram matrix of §7.3 is the same object, over independent features, so its spectral-norm error — not only the entrywise measured there — is a matrix Bernstein bound; and a sketch of a design or kernel matrix, a sum of independent rank-one terms, is bounded the same way.
The practitioner's use is a spectral-norm error bar: a covariance, Gram or attention-statistics matrix estimated from draws comes with a bound of order on , with and read off the data's norm bound. Two grades, as throughout: the inequality is L1; "my draws are independent with bounded norm" is L3 until checked — tokens within one sequence or activations along one trajectory are not independent draws, and the largest in the sample is a lower bound on , not . The sub-Gaussian hypothesis of Theorem 4.7.1, which is §7.1's norm applied to every one-dimensional marginal , is exactly what removes that logarithm; and Talagrand's concentration inequality for empirical processes is the supremum-over-a-class version of the same bound, the tool behind the sharp forms of §7.5.
§14 d = 256
n = 0.25d = 64: ||Sigma_hat - I||_op = 7.741 sqrt(d/n) = 2.000 (2*sqrt(d/n)+d/n = 8.000)
n = 1d = 256: ||Sigma_hat - I||_op = 2.972 sqrt(d/n) = 1.000 (2*sqrt(d/n)+d/n = 3.000)
n = 4d = 1024: ||Sigma_hat - I||_op = 1.289 sqrt(d/n) = 0.500 (2*sqrt(d/n)+d/n = 1.250)
n = 16d = 4096: ||Sigma_hat - I||_op = 0.563 sqrt(d/n) = 0.250 (2*sqrt(d/n)+d/n = 0.562)
n = 64d = 16384: ||Sigma_hat - I||_op = 0.261 sqrt(d/n) = 0.125 (2*sqrt(d/n)+d/n = 0.266)The measured error tracks to two digits — each row is one sample covariance, a single draw rather than an average, compared to the limit law and not to a standard error — which is the Bai–Yin law for the extreme eigenvalues of a Wishart matrix: for the largest eigenvalue of sits near and the smallest near . At the smallest eigenvalue is near zero and the largest near four — the estimated covariance of a -dimensional Gaussian from samples has a condition number of order — about here, since at the smallest eigenvalue is of order (Edelman 1988), not merely "near zero" — when the truth is one. Three consequences: whitening with an empirical covariance in high dimension amplifies the directions that are least well estimated; shrinkage estimators (Ledoit–Wolf) exist because of this table; and any method that inverts a covariance of activations, gradients or features — natural gradient, K-FAC, Mahalanobis anomaly scores, LDA — needs a large multiple of or a regulariser that stands in for the missing samples. L1.
The two edges are stated for , and the table's first row is not in that regime. At the sample covariance has , so exactly of its eigenvalues are zero — almost surely, for a Gaussian sample; of at — and in those directions nothing about noise is being measured: the data span an -dimensional subspace and vanishes identically outside it. The same two edges still bound the nonzero eigenvalues, because, with the matrix whose columns are the , the nonzero spectrum of is that of the matrix , a Wishart matrix with degrees of freedom whose Marchenko–Pastur edges are — the formula is symmetric under the swap. At the nonzero eigenvalues lie, in the limit, in , so , which is why the row still tracks ( in a single draw). The moral is sharper than "noisy": at the estimate is singular by rank, not by noise, and no averaging within the same draws makes it invertible — regularise (shrinkage, ridge) before inverting, and read the first row as a statement about the directions the data saw, not the the model has. §53 draws a fresh , sample and prints the zero-eigenvalue count and the smallest nonzero eigenvalue, followed by the replicated-RMSE spread of §6.4's Pareto experiment, which lives in the same block:
§53 An empirical RMSE of an infinite-variance mean (20 batches of the §39 experiment), and the rank of a sample covariance at n < d
(a) Pareto(alpha = 1.5), x_min = 1, as §39 (U^(-1/alpha)): true mean 3.0000, Var = +inf (alpha <= 2), so the POPULATION RMSE of the sample mean is +inf at every n; the numbers below are statistics of the simulation (20 independent batches of 1,000 replications of n = 10,000, g53)
(a) batch 1: empirical RMSE of the sample mean 0.6206, of median-of-means (20 blocks of 500) 0.1919; 99th pct |error|: 1.2541 / 0.3420; max |error| of the sample mean 17.898
(a) batch 2: empirical RMSE of the sample mean 0.3169, of median-of-means (20 blocks of 500) 0.1952; 99th pct |error|: 0.8952 / 0.3497; max |error| of the sample mean 5.468
(a) batch 3: empirical RMSE of the sample mean 0.3159, of median-of-means (20 blocks of 500) 0.1939; 99th pct |error|: 0.9192 / 0.3672; max |error| of the sample mean 5.845
(a) batch 4: empirical RMSE of the sample mean 0.2939, of median-of-means (20 blocks of 500) 0.1885; 99th pct |error|: 0.7636 / 0.3420; max |error| of the sample mean 6.788
(a) batch 5: empirical RMSE of the sample mean 0.5791, of median-of-means (20 blocks of 500) 0.1903; 99th pct |error|: 0.8267 / 0.3370; max |error| of the sample mean 15.284
(a) batch 6: empirical RMSE of the sample mean 0.6048, of median-of-means (20 blocks of 500) 0.1987; 99th pct |error|: 0.9206 / 0.3568; max |error| of the sample mean 17.902
(a) batch 7: empirical RMSE of the sample mean 0.6352, of median-of-means (20 blocks of 500) 0.1930; 99th pct |error|: 1.0102 / 0.3462; max |error| of the sample mean 15.871
(a) batch 8: empirical RMSE of the sample mean 0.6209, of median-of-means (20 blocks of 500) 0.1891; 99th pct |error|: 1.7519 / 0.3456; max |error| of the sample mean 15.300
(a) batch 9: empirical RMSE of the sample mean 0.2439, of median-of-means (20 blocks of 500) 0.1909; 99th pct |error|: 1.0812 / 0.3413; max |error| of the sample mean 2.965
(a) batch 10: empirical RMSE of the sample mean 0.2801, of median-of-means (20 blocks of 500) 0.1925; 99th pct |error|: 0.8393 / 0.3410; max |error| of the sample mean 5.248
(a) batch 11: empirical RMSE of the sample mean 0.2679, of median-of-means (20 blocks of 500) 0.1940; 99th pct |error|: 0.7846 / 0.3480; max |error| of the sample mean 5.328
(a) batch 12: empirical RMSE of the sample mean 0.3081, of median-of-means (20 blocks of 500) 0.1904; 99th pct |error|: 1.0228 / 0.3354; max |error| of the sample mean 4.635
(a) batch 13: empirical RMSE of the sample mean 0.1806, of median-of-means (20 blocks of 500) 0.1902; 99th pct |error|: 0.6960 / 0.3308; max |error| of the sample mean 1.333
(a) batch 14: empirical RMSE of the sample mean 0.3586, of median-of-means (20 blocks of 500) 0.1942; 99th pct |error|: 0.9358 / 0.3616; max |error| of the sample mean 6.259
(a) batch 15: empirical RMSE of the sample mean 0.9847, of median-of-means (20 blocks of 500) 0.1911; 99th pct |error|: 1.0313 / 0.3535; max |error| of the sample mean 30.391
(a) batch 16: empirical RMSE of the sample mean 0.4965, of median-of-means (20 blocks of 500) 0.1943; 99th pct |error|: 1.2276 / 0.3485; max |error| of the sample mean 11.479
(a) batch 17: empirical RMSE of the sample mean 0.3184, of median-of-means (20 blocks of 500) 0.1933; 99th pct |error|: 0.9026 / 0.3510; max |error| of the sample mean 6.720
(a) batch 18: empirical RMSE of the sample mean 0.5554, of median-of-means (20 blocks of 500) 0.1890; 99th pct |error|: 1.0823 / 0.3362; max |error| of the sample mean 13.259
(a) batch 19: empirical RMSE of the sample mean 0.4922, of median-of-means (20 blocks of 500) 0.1953; 99th pct |error|: 0.7698 / 0.3578; max |error| of the sample mean 12.117
(a) batch 20: empirical RMSE of the sample mean 0.2286, of median-of-means (20 blocks of 500) 0.1898; 99th pct |error|: 0.8206 / 0.3310; max |error| of the sample mean 2.362
(a) across the 20 batches — sample mean RMSE: min 0.1806, median 0.3385, max 0.9847 (max/min 5.45x); median-of-means RMSE: min 0.1885, median 0.1922, max 0.1987 (max/min 1.05x)
(a) 99th-percentile |error| across batches — sample mean: min 0.6960, max 1.7519; median-of-means: min 0.3308, max 0.3672 (the empirical RMSE of the sample mean is driven by the largest single draw in each batch and does not settle; the median-of-means statistics do)
(b) d = 256, n = 64 (d/n = 4), single draw (no SE): eigenvalues of (1/n) X^T X below 1e-10: 192 (exactly max(d - n, 0) = 192); smallest nonzero 1.0512e+00, largest 9.0261 vs the Marchenko-Pastur edges (1 -+ sqrt(d/n))^2 = 1.0000, 9.0000; ||Sigma_hat - I||_op = 8.0261 vs 2 sqrt(d/n) + d/n = 8.0000
(b) d = 256, n = 256 (d/n = 1), single draw (no SE): eigenvalues of (1/n) X^T X below 1e-10: 0 (exactly max(d - n, 0) = 0); smallest nonzero 6.5932e-06, largest 3.9281 vs the Marchenko-Pastur edges (1 -+ sqrt(d/n))^2 = 0.0000, 4.0000 (at d = n the lower edge is 0 and the smallest eigenvalue is of order 1/d^2 = 1.5e-05); ||Sigma_hat - I||_op = 2.9281 vs 2 sqrt(d/n) + d/n = 3.0000
(b) d = 256, n = 1024 (d/n = 0.25), single draw (no SE): eigenvalues of (1/n) X^T X below 1e-10: 0 (exactly max(d - n, 0) = 0); smallest nonzero 2.5235e-01, largest 2.2137 vs the Marchenko-Pastur edges (1 -+ sqrt(d/n))^2 = 0.2500, 2.2500; ||Sigma_hat - I||_op = 1.2137 vs 2 sqrt(d/n) + d/n = 1.2500The count is exactly and the smallest nonzero eigenvalue sits near the lower edge — the rank statement made numerical, and a reminder that "smallest eigenvalue" means the smallest nonzero one once ; the Pareto lines belong to §6.4's discussion and are read there.
7.5 Uniform convergence: from Hoeffding to a generalisation bound, and where it goes vacuous
A learner picks from a class to minimise the empirical risk . Hoeffding bounds for one fixed ; the learner's choice depends on the sample, so the bound must hold for all at once. For a finite class and a loss with values in — the hypothesis every display in this subsection carries — the union bound does it: with probability ,
§16 |H|= 1000000, n= 10000: uniform deviation bound 0.0296
|H|= 1000000, n= 100000: uniform deviation bound 0.0094
|H|= 2^32000, n= 100000: uniform deviation bound 0.3330The third line is a network with a thousand -bit parameters, treated as a class of functions: the bound is at and has said nothing. The remedies are the subject of statistical learning theory, and each is a concentration argument: symmetrisation replaces the supremum over by its Rademacher complexity over random signs — the capacity of the class to fit noise — and McDiarmid shows the supremum concentrates around its mean at rate ; VC dimension bounds the Rademacher complexity for binary classes by Sauer's lemma; PAC-Bayes and the information-theoretic bounds our earlier piece's §10.2 covered replace the count of hypotheses by a divergence between a posterior and a prior over them, which is where the dependence on the algorithm rather than the class enters. For deep networks, every one of these is known to be loose by orders of magnitude on real training runs — Zhang et al. (2017)'s experiment, in which the same network fits random labels, shows the Rademacher complexity of the class is essentially maximal and any class-based bound is vacuous. We grade the inequalities L1 and every "this is why deep networks generalise" L3 at best: the inequalities are true and the mechanism they describe is not the operative one.
Four bridges from class counting to what is actually proved, each graded in two parts. Rademacher complexity is the expected supremum of an empirical process — is the mean of a centred sum, maximised over — and a Rademacher bound has two steps: the concentration step, that the supremum of the empirical–population gap sits within of its mean (McDiarmid, L1 without qualification), and the choice of complexity measure that bounds the mean (VC dimension, covering numbers, norm-based bounds, margins), which is L2–L3 for a deep network because the measure that is small on the trained network is not known. VC dimension is the oldest of those complexity measures and has the same two-step shape: if a binary class has VC dimension , the Sauer–Shelah lemma says it realises at most labellings of points, and Massart's finite-class lemma turns that count into a bound on the Rademacher mean, — VC theory is the combinatorial control of the mean in the Rademacher bound, , with the concentration step untouched. L1 as a theorem; for a piecewise-linear network with parameters and layers the VC dimension is , with a lower bound — nearly tight, and linear in the depth rather than logarithmic (Bartlett, Harvey, Liaw & Mehrabian 2019): classical capacity bounds reflect depth as well as parameter count, and remain potentially vacuous for modern networks, which is what the third line of §16 buys.
Algorithmic stability (Bousquet & Elisseeff 2002) replaces the class by the algorithm, and it comes in two stages that have different modes. The stage in expectation: if replacing one training example changes the learned predictor's loss at every point by at most (uniform stability), then , by a one-line exchange of the replaced example (Hardt, Recht & Singer 2016, Thm 2.2; with Bousquet & Elisseeff's leave-one-out definition of the constant is , and the two definitions are within a factor of two of each other) — L1. The stage with high probability is a different theorem with a worse constant. Bousquet & Elisseeff's Theorem 12 gives, for a loss bounded by and their , with probability ,
and the stability term is : it scales as , not as , so the bound is informative only when , and a stability of order buys a gap of order and nothing better. (The step is McDiarmid applied to as a function of the sample, whose bounded differences are of order — that is where the comes from, and the "" sometimes quoted is not what that argument gives.) Feldman & Vondrák (2019) bring the high-probability stability term down to times a polylogarithm of , by a different and harder argument. The ML instance is the stability constant of SGD itself: on a convex loss that is -Lipschitz with an -Lipschitz gradient, at steps , (Hardt, Recht & Singer 2016, Thm 3.8) — after steps at step — a theorem about the optimiser rather than the function class, stated in expectation over the algorithm's own randomness, and the reason "train faster, generalise better" is a slogan with a proof behind it (in the non-convex case their constant grows with and the statement is L2). The generalisation gap has modes too, exactly as §5.1's limits do: a guarantee in expectation is not one with high probability, and the two stages above are the two modes at their two prices.
PAC-Bayes is the fourth bridge, and it changes what is counted. For a loss with values in , any prior on hypotheses fixed before the data and any posterior chosen after it, with probability over the sample and simultaneously for every ,
(McAllester 1999 for the first form, with and slightly larger constants; the version displayed is Maurer's tightening (2004), and Catoni (2007) gives the sharper exponential-moment forms). The bounded loss is a hypothesis, not a convention: the classification error qualifies, and log-loss — cross-entropy — does not, since it is unbounded; the displays of this subsection apply to it only after a truncation, or under a tail (sub-Gaussian or sub-exponential) or exponential-moment condition on the loss, and PAC-Bayes bounds for unbounded losses exist under exactly such conditions (Alquier 2024, User-friendly introduction to PAC-Bayes bounds).
The union bound over a finite class is the case uniform and a point mass, where ; for a network the KL between a posterior over weights and a prior fixed in advance can be far smaller than any count of functions, which is where the dependence on the algorithm rather than the class enters. The inequality is L1; the choice of prior and posterior that make it tight for a trained network is L3, and the one demonstration that it can be done — a non-vacuous bound for a stochastic MNIST network, obtained by optimising the posterior against the bound itself — is Dziugaite & Roy (2017). Margins enter all four bridges as the scale on which the loss is Lipschitz. The probability in every one of them is the concentration of this section; the learning theory is in the choice of what to concentrate, and beyond these paragraphs the piece does not go.
Checkpoint exercise 6b. Four bounds appeared in this subsection: the single-hypothesis Hoeffding bound (the test-set bound of §7.6), uniform convergence over a class (the finite-class union bound, Rademacher or VC), uniform stability, and PAC-Bayes. Which of them apply, as displayed, to (a) a model scored by cross-entropy, which is unbounded; (b) a model selected adaptively — a sweep whose next candidate was chosen by looking at the scores so far; (c) the – loss of one fixed classifier; (d) a randomised classifier that draws its weights from a distribution at prediction time? ((a) None of the four as displayed — each assumed a loss in ; truncate the loss, or assume a tail or exponential-moment condition on it and use the unbounded-loss forms. (b) Uniform convergence over the class the sweep ranged over — the union bound, Rademacher or VC — or PAC-Bayes with a prior fixed before the data, which holds for every posterior at once; not the single-hypothesis Hoeffding bound, whose must be fixed before the sample, and not stability unless the whole selection procedure is the algorithm whose is bounded. (c) All four, each under its own hypotheses — the case the displays were written for. (d) PAC-Bayes natively, since its left-hand side is already ; the other three apply to the expected loss of the randomised predictor, treated as one hypothesis or one algorithm.)
What is operative and exact is the test-set bound, which is Hoeffding with : a held-out set the model never touched gives with probability , for any model however complex, and it is the next subsection.
7.6 The eval-set error bar, as a table
Fast path · stop 9 of 14. Next stop: §8.2. This section's numbers run in
02_fast_path.ipynb.
Every comparison of two models on a benchmark is a statement about two sample means. The numbers:
§15 Hoeffding n for half-width eps at 95%: eps=0.05: 738 eps=0.02: 4,612 eps=0.01: 18,445 eps=0.005: 73,778
acc=0.80, n=1000: binomial sd = 0.0126; 95% normal half-width = 0.0248; Hoeffding half-width = 0.0429
paired comparison, n=1000, disagreement rate 10%, A wins 55% of them: gap = 0.0100, sd ~ 0.0100 -> 1.00 sdThree things to read off:
- Resolving a single accuracy to point needs on the order of examples by Hoeffding, and about by the normal approximation with the binomial variance at accuracy () (Hoeffding is loose by here because it ignores the variance; at a small rate use the Clopper–Pearson or Wilson interval instead, which §6.3 said stay honest when the Gaussian does not). An unpaired one-point difference between two models has twice the variance, so both numbers double — by the binomial and by Hoeffding — which is the in exercise 7.
- Pairing changes the question, and the discordance pattern decides it. On the same test set the two models agree on most examples; only the disagreements carry information. With a disagreement rate at there are informative examples, and a split among them — a one-point accuracy gap — is one standard deviation: McNemar's exact two-sided test, which is the binomial test of successes in fair trials, gives . The same one-point gap produced by discordant examples all won by the same model is : ten of ten is decisive, fifty-five of a hundred is noise, and the two accuracies — apart in both cases — cannot tell the cases apart. So a one-point gap at is not "noise"; it is unresolved until the comparison is paired and the discordant pairs are counted (§35 computes both cases, and exercise 7's). The paired test (McNemar's) uses this; an unpaired comparison of two accuracies discards it and is weaker.
- The bound is per comparison, and for a fixed menu. Selecting the best of models or checkpoints on the same test set is a union bound over , and the chosen model's test score is biased upward by at most the expected maximum of centred deviations — which, for variables that are sub-Gaussian with a common proxy , is whatever the correlation among them. What is for an accuracy is where the care goes. The guarantee comes from Hoeffding's lemma: a -valued correctness indicator has sub-Gaussian proxy per example — the range, not the variance — so the mean of has proxy , , and the selection bias is at most : at and , . The Gaussian approximation replaces by the binomial standard deviation at and gives ; it is the right order of magnitude and it is not a theorem, because is not a valid sub-Gaussian proxy for a Bernoulli: at , , above the a proxy of would have to deliver, while Hoeffding's holds (§42(a)). Under either number the bound is nearly attained only if the scores were independent, where the exact expected maximum of normals is ; dependence on a shared test set changes the selection bias according to the covariance structure, not in one direction — models that err on the same examples (strong positive correlation) shrink it, models that err on complementary examples (negative correlation) enlarge it. For two centred Gaussian scores with correlation , : at , at independence, at — two classifiers that always disagree, so that one is right exactly when the other is wrong (§52 prints the five cases against the closed form) — while the Hoeffding bound holds whatever the dependence. Either way, up to three to five points of accuracy can be the selection, not the model. The second assumption is that the candidates were fixed before anyone looked at their test scores — no independence among the is needed, but the menu must not have been written by the test set. Candidates built after looking at the test scores (a sweep steered by the leaderboard) are the adaptive case of the block below, where no longer controls anything. §8 gives the fixed-menu case its proper name. §42 checks the moment generating function, prints both numbers, and measures the expected maximum over independent models with its Monte Carlo standard error:
§42 Selecting the best of m = 100 fixed models on n = 1,000 held-out examples: the variance-proxy bound sigma sqrt(2 ln m) is not a Hoeffding guarantee
(a) X ~ Bernoulli(0.8): E[e^(-(X-0.8))] = 0.8 e^-0.2 + 0.2 e^0.8 = 1.10009 > e^(Var(X)/2) = e^0.08 = 1.08329 -> p(1-p) is NOT a valid sub-Gaussian variance proxy; Hoeffding's proxy 1/4 holds: e^(1/8) = 1.13315 >= 1.10009
(b) n=1,000, m=100, p=0.8: sigma = sqrt(p(1-p)/n) = 0.01265; variance-proxy bound sigma sqrt(2 ln m) = 0.0384 (not a guarantee for Bernoulli) Hoeffding-valid sqrt(ln m / (2n)) = 0.0480
(c) 2,000 replications: mean of max_j (accuracy_j - 0.8) = 0.0312 (MC SE 0.0001; median 0.0310, 99th pct 0.0440) — under both 0.0384 and 0.0480; only the second is a proven bound on E[max]
(c) fraction of replications whose max exceeds the variance-proxy bound 0.0384: 0.0835; exceeds the Hoeffding bound 0.0480: 0.0045The measured expected maximum, over replications of independent models, sits under both numbers and within a digit of the Gaussian ; the realised maximum exceeds in of replications and in , which is the reminder that both numbers bound the expectation of the selection bias and neither bounds its realisation. The dependence claim of item 3 has its own check — the expected maximum of two correlated scores at against — printed in §52, which also carries the shifted-Cauchy coupling that §2.4 cites:
§52 Correlated maxima and a shifted Cauchy: E max of two correlated normals, of 100 equicorrelated normals, and a W1 that exists when no moment does
(a) exact E max(Z1, Z2), Z1, Z2 standard normal with correlation rho: sigma sqrt((1 - rho)/pi) = E|Z1 - Z2|/2; rho = -1.0: 0.7979, rho = -0.5: 0.6910, rho = +0.0: 0.5642, rho = +0.5: 0.3989, rho = +1.0: 0.0000
(b) Monte Carlo, R = 200,000 pairs, rho = -1.0: mean max 0.7971 ± 0.0013 (exact 0.7979)
(b) Monte Carlo, R = 200,000 pairs, rho = -0.5: mean max 0.6925 ± 0.0016 (exact 0.6910)
(b) Monte Carlo, R = 200,000 pairs, rho = +0.0: mean max 0.5631 ± 0.0018 (exact 0.5642)
(b) Monte Carlo, R = 200,000 pairs, rho = +0.5: mean max 0.4004 ± 0.0021 (exact 0.3989)
(b) Monte Carlo, R = 200,000 pairs, rho = +1.0: mean max 0.0008 ± 0.0022 (exact 0.0000)
(c) m = 100 iid standard normals: E max = int x m phi(x) Phi(x)^(m-1) dx = 2.5076 (trapezoid on [-12, 12], step 1e-05); sqrt(2 ln m) = 3.0349 for scale
(c) m = 100 scores with common correlation rho = 0.0 (Z_j = sqrt(rho) W + sqrt(1 - rho) e_j), R = 20,000: E max = 2.5076 ± 0.0030 (exact: sqrt(rho) E W + sqrt(1 - rho) E max_j e_j = sqrt(1 - rho) x 2.5076 = 2.5076; independent value 2.5076)
(c) m = 100 scores with common correlation rho = 0.5 (Z_j = sqrt(rho) W + sqrt(1 - rho) e_j), R = 20,000: E max = 1.7764 ± 0.0055 (exact: sqrt(rho) E W + sqrt(1 - rho) E max_j e_j = sqrt(1 - rho) x 2.5076 = 1.7731; independent value 2.5076)
(c) m = 100 scores with common correlation rho = 0.9 (Z_j = sqrt(rho) W + sqrt(1 - rho) e_j), R = 20,000: E max = 0.7906 ± 0.0067 (exact: sqrt(rho) E W + sqrt(1 - rho) E max_j e_j = sqrt(1 - rho) x 2.5076 = 0.7930; independent value 2.5076)
(c) m = 2, rho = -0.5 (the common-correlation construction needs rho >= -1/(m - 1): -1 for m = 2, -1/99 for m = 100), R = 20,000: E max = 0.6898 ± 0.0051 (exact 0.6910, as in (a))
(d) shifted Cauchy, P = Cauchy(0,1), Q = Cauchy(1,1): F_P - F_Q = (arctan x - arctan(x - 1))/pi >= 0 everywhere (min on the grid 3.2e-15); W1 = int |F_P - F_Q| dx on [-1e7, 1e7] = 1.0000 (exact 1: a shift by c costs exactly c, whatever the tails; the mass beyond ±1e7 is 2/(pi 1e7) = 6.4e-08)
(d) sample first absolute moment (1/n) sum |X_i| of one Cauchy sample path from g52, at n = 10^3, 10^4, 10^5, 10^6: 4.934, 4.786, 12.333, 9.763 — a single path, no SE: E|X| = infinity, so the running mean has no limit; its typical size is (2/pi) ln n = 4.4, 5.9, 7.3, 8.8 at these n, with fluctuations of the same order
(d) Cauchy vs N(0,1): W1(P, Q) >= |E_P|X| - E_Q|Y|| for any coupling, and E_Q|Y| = sqrt(2/pi) = 0.7979; lower bound on any coupling's cost, from a truncated sample (the same running means minus 0.7979): n = 10^3: 4.136, n = 10^4: 3.988, n = 10^5: 11.535, n = 10^6: 8.965 — the bound does not settle and is unbounded in n: W1(Cauchy, N(0,1)) = infinity while W1(Cauchy(0,1), Cauchy(1,1)) = 1The two-score maximum follows the closed form across the five correlations, largest where the models disagree most and zero where they agree completely — item 3's covariance-structure statement made numerical; the Cauchy lines are §2.4's coupling and are read there. The paired case of item 2, with exercise 7's numbers as the third line:
§35 McNemar on a paired evaluation: the same one-point gap at n = 1,000 is noise with 100 discordant pairs and decisive with 10
(i) discordant = 100, B wins 55: gap = 1.0 points of 1000; exact two-sided p = 0.368202; normal-approximation z = 1.000
(ii) discordant = 10, B wins 10: gap = 1.0 points of 1000; exact two-sided p = 0.001953 (= 2 * (1/2)^10 = 0.001953)
(iii) exercise 7 discordant = 160, B wins 95: gap = 1.5 points of 2000; exact two-sided p = 0.021574; normal-approximation z = 2.372Line (iii) is exercise 7's case — of discordant on , a -point gap, exact , which is the " sd — resolved" of its answer; line (i) is the one-standard-deviation case of item 2, unresolved at ; line (ii) is the same one-point gap, decisive at . One rule follows from the three lines together: the criterion for a paired comparison is a confidence interval on the paired difference — built from the per-example differences, which here are the discordant pairs — and never the overlap of the two models' individual intervals, which ignores the pairing: line (ii)'s two accuracies are apart with individual intervals wide, so the intervals overlap almost entirely while the paired difference is resolved at .
Appendix C.1 is this table read against a measured case on E2. The one-line policy it supports: report , report the interval, pair when you can, and treat a difference inside the interval as unresolved rather than as a small effect.
Action changed. A paired comparison of two models on one test set is reported as the paired difference with its own interval — from the per-example differences , or McNemar's exact test on the discordant pairs — never as two accuracies with two intervals and a judgement about their overlap; the two reports can disagree on the same data (lines (i) and (ii) above), and only the first is a test of the difference.
What the bound assumes, and four things that break it. Hoeffding's is L1 — on the distribution the test set was drawn from, for a model fixed before the draw, with the examples independent of each other. The theorem is one grade; each clause is an assumption to disclose, and each has a standard way of failing:
- The test examples are independent of each other. A million tokens of held-out text from a thousand documents are not a million Bernoulli trials; the unit at which independence holds is the document, and the per-token loss within one document is a dependent stream whose average has the inflated variance of §9.1 — the long-run variance, not . Report cluster-level (document-level, prompt-level, user-level) error bars, or a block bootstrap over the units (§9.1), and count in units, not tokens. The Hoeffding in the table above is a count of independent examples.
- The model was fixed before the test set was seen. The union bound over in item 3 controls a fixed menu; it does not control a menu that was written by looking at the test scores. Adaptive reuse — tuning on the test set, selecting prompts against it, iterating a model family against a public leaderboard — breaks the bound in a way cannot repair, because the effective is the number of models that could have been tried given what was learned from the scores, which is unbounded. Dwork et al. (2015)'s reusable holdout is the theorem about what can still be guaranteed under adaptive queries (the answers have to be noised and the queries that overfit charged to a budget), and the public-leaderboard effect — a benchmark whose top scores drift upward with no matching change in deployed capability — is the measured symptom. Information leakage, training data that overlaps the test set, is the same failure in a different place: the "held-out" set was not held out. Grade: the bound is L1 for a model fixed in advance, and a score obtained after adaptive contact with the test set is an estimate of nothing in particular until that contact is accounted for.
- The test distribution is the deployment distribution. Hoeffding says what the model's error is on the law the test set was drawn from, and only there. Any statement about error in deployment is a hypothesis about distribution shift — covariate shift, label shift, a new population of users — that the test set cannot speak to; it is L3 until the deployment distribution is measured, and the error bar on the benchmark number does not transfer. The one finite-sample guarantee that survives a known kind of shift is the one built on exchangeability between calibration and test data (conformal prediction, which §11 reaches through exchangeability), and shift breaks exactly that.
- Seed variance is a separate term. The interval above is the uncertainty from the test set for one trained model. Retraining with a different seed, data order or initialisation gives a different model with a different true error ; that spread is a property of the training procedure, is not in the Hoeffding interval, and at is often larger than it. A comparison of two procedures needs both terms — several seeds each, and the test-set interval on each — and "is model A better than model B" is a different question from "is procedure A better than procedure B".
So a reported accuracy has four sources of uncertainty — test-set sampling, dependence among the examples, adaptive reuse, and seed variance — and the Hoeffding table prices exactly one of them. The table is not wrong; it is the floor.
Theorem card — the fixed-test-set bound. Object: the mean of independent -valued losses on a held-out set, for one model fixed before the set was drawn. Theorem: Hoeffding — with probability , for any model however complex (§7.5 with ). Guarantee does not apply when: the examples are dependent (tokens within a document), the model or the menu of models was chosen using the test scores, the deployment distribution differs from the test distribution, or the question is about the training procedure rather than this one model. Action: report in independent units, the interval, and whether the comparison was paired; treat a difference inside the interval as unresolved; keep one held-out set on which nothing is selected.
Checkpoint exercise 7. A benchmark has examples and two models score and . Is the gap resolved (a) unpaired, by the binomial; (b) paired, if they disagree on of examples and model B wins of those? (Each accuracy has sd ; the unpaired difference has sd , so points is sd — unresolved. Paired: disagreements, B wins against an expected under no difference — the same -point gap, — sd , so sd — resolved at the level. Same data, different question, opposite verdict; the paired test is the right one.)
Diagnostic exercise B. Two teams each report a paired comparison of models A and B on the same benchmark, and both report B ahead by exactly one point. Team 1: the models disagree on examples and B wins . Team 2: they disagree on and B wins all . Team 1 concludes "B is better — the same gap team 2 found"; team 2 concludes "the gap is within noise, as team 1's is". Diagnose both conclusions. (Both are wrong, in opposite directions. The accuracy gap is identical, , but the test lives on the discordant pairs: team 1's of is one standard deviation, exact two-sided , unresolved; team 2's of is , resolved. A gap is not evidence; a gap together with the number of discordant pairs that produced it is. Team 2's models also disagree on only of examples, which is a finding about how alike the two models are and not about the test — a decisive verdict on a one-point gap is compatible with the two models being nearly the same model.)
8. Martingales: the σ-algebra pays off
8.1 Definition, and five that you already have
A filtration (§1.6 glossary) is an increasing family of σ-algebras (§1.6 glossary) : what is known after steps. A process is adapted if is -measurable (a measurable function, §1.6 glossary), and it is a martingale if additionally and
A supermartingale has (it drifts down), a submartingale . A stopping time (§1.6 glossary) is a random with — a rule that decides to stop using only what has been seen. Five martingales that appear in this piece:
- Partial sums of centred independent variables, — the E1 running total minus .
- The Doob martingale of any integrable (the conditional expectation, §1.6 glossary): your best estimate of as information arrives. By the tower property it is a martingale, and it converges to when is -measurable. Every Bayesian posterior mean is one of these.
- The likelihood ratio when the are i.i.d. from : when (absolute continuity, §1.6 glossary), so is a non-negative martingale with mean one under the null (if puts mass where does not, the integral is and is a supermartingale, which is all §8.2 needs).
- The fraction of red balls in a Pólya urn (§11) — after draws from one red and one blue, with the reds drawn. The running proportion of an exchangeable sequence is not a martingale in this direction; it is a backward martingale, indexed by decreasing , and that is how de Finetti's theorem is proved (the limiting frequency of §11 exists because a backward martingale converges).
- A fair gambler's wealth under any betting strategy that uses only the past — the original example (Ville 1939, Doob 1940), and the reason the optional stopping theorem is also called "you cannot beat a fair game".
The measurability clause in "stopping time" is the whole content, and a schematic on E1 — the fair-coin stream , with — shows it. Let be the first at which two heads have just come up in a row, and the last at which the running total is exactly :
| knows | ||||
| is decidable from ? | yes — it is | yes — it is | yes — | yes, at every |
| is decidable from ? | no — needs | no | no | not until |
is a stopping time, and every theorem below applies to it; is not — "stop at the last time the coin was level" is a rule that needs the future — and the theorems below say nothing about it, which is the formal reason a strategy that sells "at the peak" has no fair-game guarantee.
8.2 Optional stopping, Ville's inequality, and the peeking analyst
Fast path · stop 10 of 14. Next stop: §8.3. This section's numbers run in
02_fast_path.ipynb.
Optional stopping theorem (Doob). If is a martingale and a stopping time, then provided one of: is bounded; is bounded and is a.s. finite; or and the increments are bounded. Without such a condition it fails — the doubling strategy (bet until the first win) has a.s. finite and surely, but needs unbounded capital.
Ville's inequality (1939). If is a non-negative supermartingale with , then for every ,
This is Markov's inequality made uniform over time, and it is the theorem that separates a valid sequential test from an invalid one. A fixed- test controls at one pre-specified . An analyst who looks at the data repeatedly and stops the first time a -statistic crosses is computing — and the law of the iterated logarithm (§5.4) says that supremum is infinite a.s., so the test rejects with probability tending to one under the null given enough looks:
§22 fair-coin null, 10,000 samples, 4,000 replications, alpha = 0.05
fixed-n z-test at n=10,000: false positive rate 0.0460
z-test peeked every 100 (100 looks): false positive rate 0.3835
test martingale, stop when E_n >= 20: false positive rate 0.0437 (Ville: <= 0.05 at EVERY stopping rule)A hundred looks turned a test into a one. Those are Monte Carlo rates at replications and carry standard errors : , , (§37(a)) — the first is within standard errors of its nominal , the third sits below the that Ville promises as a ceiling, and the second is more than forty standard errors above it. The third line is a test martingale: with , a non-negative martingale with under the fair-coin null (each factor has conditional mean one), so Ville's inequality guarantees under every stopping rule simultaneously — peek as often as you like. This is the construction behind "anytime-valid" inference and e-values (Ramdas, Grünwald, Vovk & Shafer (2023)); the price for the freedom to stop is that the test has less power at any fixed than the fixed- test, as the you commit to is a bet on the alternative — and a bet can lose outright: at the branch has expected log-growth , which is negative for every , so against a coin at the martingale shrinks and the probability of ever crossing the threshold does not go to one with . Exercise 8 works that case out.
The bet does not have to be a single . An average of test martingales is a test martingale — each is non-negative with and conditional mean one under the null, and both properties survive averaging — so the mixture is covered by Ville's inequality exactly as the single- one was: under every stopping rule, with no new theorem. What changes is the power. Against a coin the branch grows at the Kelly rate of exercise 8 while the branch shrinks, and the mixture, which is at least of its best branch, grows at the best branch's rate after a one-off cost of ; it does not need to know in advance, which the fixed bet did. §37 measures the mixture's null rate and its power against the fixed at and :
§37 Monte Carlo standard errors for the §22 false-positive rates, and a mixture test martingale that bets on several lambdas at once
(a) §22 fixed-n z-test rate 0.0460 at 4,000 replications: SE = sqrt(p(1-p)/4000) = 0.0033
(a) §22 z-test peeked every 100 rate 0.3835 at 4,000 replications: SE = sqrt(p(1-p)/4000) = 0.0077
(a) §22 test martingale E_n >= 20 rate 0.0437 at 4,000 replications: SE = sqrt(p(1-p)/4000) = 0.0032
(b) growth rate per step at P(1)=0.6: lambda=0.1: +0.0150, lambda=0.2: +0.0201, lambda=0.3: +0.0147, lambda=0.5: -0.0340 (p log(1+lambda) + (1-p) log(1-lambda); the optimum is lambda = 2p-1)
(b) growth rate per step at P(1)=0.55: lambda=0.1: +0.0050, lambda=0.2: -0.0001, lambda=0.3: -0.0162, lambda=0.5: -0.0889 (p log(1+lambda) + (1-p) log(1-lambda); the optimum is lambda = 2p-1)
(b) null P(1)=0.5, 2,000 replications, n=10,000: mixture (8 branches) false-positive rate of 'stop when E_n >= 20' = 0.0465 (SE 0.0047); fixed lambda=0.5 (§22) = 0.0485 (SE 0.0048); Ville bound 0.0500
(b) alternative P(1)=0.6: mixture crosses 20 by n=10,000 in 1.0000 of runs, median crossing time 169; fixed lambda=0.5 crosses in 0.4065 of runs, median crossing time 61
(SE of the line above: mixture fraction ± 0.0000, median crossing time ± 6; fixed lambda=0.5 fraction ± 0.0110, median ± 4 — binomial SEs from the same 2,000 runs; median SEs are half the order-statistic 68% interval of the crossing times)
(b) alternative P(1)=0.55: mixture crosses 20 by n=10,000 in 1.0000 of runs, median crossing time 771; fixed lambda=0.5 crosses in 0.0930 of runs, median crossing time 34
(SE of the line above: mixture fraction ± 0.0000, median crossing time ± 24; fixed lambda=0.5 fraction ± 0.0065, median ± 3 — binomial SEs from the same 2,000 runs; median SEs are half the order-statistic 68% interval of the crossing times)The null rates of the mixture () and of the fixed bet () are both at or under Ville's , as they must be; the power is where they part. Against the coin the fixed crosses in of runs by — the "does not go to one" of the paragraph above, measured — and the mixture in every run, at a median of samples; against the coin, where only the branch has a positive growth rate ( per step), the fixed bet crosses in of runs and the mixture in every one, at a median of . The mixture pays once for not knowing , and that is the whole price.
Inverting a family of such martingales over the null parameter — keeping, at every , the values of the running martingale has not rejected — gives a confidence sequence, an interval valid uniformly over time, so that it can be read at any stopping rule with the stated coverage (Howard, Ramdas, McAuliffe & Sekhon 2021); it is the anytime-valid counterpart of the fixed- interval of §7.6, and its price is the one above, a wider interval at any fixed .
Three places this is the operative theorem in a training pipeline, graded one by one:
- Early stopping on a validation curve is a stopping time applied to a noisy process, but not the §5.4 process. The validation loss at step is evaluated on one fixed held-out set, so its sampling noise is a single draw shared by every checkpoint, not a running average of fresh terms; what moves with is the model. "Stop when it stops improving for steps" still evaluates a supremum over time, but the excursion it selects is the maximum over correlated estimates — at most §7.6's — and the LIL envelope applies only when the monitored quantity is a running average of a stream. The remedy is structural either way: a separate held-out set the stopping rule never sees, so that the final number is a fixed- estimate again. L3: the mechanism is a stopping rule on a noisy curve, but the curve's dependence on is the training dynamics, which no theorem here models.
- Checkpoint selection is the union bound of §7.6 with equal to the number of checkpoints; optional stopping is its sequential cousin. L1.
- A/B tests and online evaluation with continuous monitoring are the §22 experiment verbatim, and the test martingale is the fix that preserves the ability to look. L1.
8.3 Maximal inequality, Azuma–Hoeffding, and where McDiarmid comes from
Fast path · stop 11 of 14. Next stop: §8.4. This section's numbers run in
02_fast_path.ipynb.
Doob's maximal inequality. For a non-negative submartingale, , and in , . The supremum of a martingale over a window costs at most a factor of two in norm over its endpoint — the reason uniform-in-time bounds (§8.2) are only slightly worse than fixed-time ones when the process is a martingale and much worse when it is not.
Azuma–Hoeffding. If is a martingale with bounded increments , then . The proof is Chernoff's with the MGF of each increment bounded conditionally on the past. McDiarmid's inequality of §7.1 is Azuma–Hoeffding applied to the Doob martingale : revealing the -th variable moves the conditional expectation within an interval of length — Hoeffding's lemma applied conditionally to an increment confined to an interval of length gives the MGF bound , which is where McDiarmid's comes from in place of the that a symmetric bound gives — and . So the uniform convergence of §7.5 and the test-set bound of §7.6 are one inequality on one object, a martingale with bounded steps; the sequential tests of §8.2 rest on the same object through Ville's inequality rather than Azuma's.
8.4 Convergence, Robbins–Siegmund, and what "SGD converges" means
Fast path · stop 12 of 14. Next stop: §12. This section's numbers run in
02_fast_path.ipynb.
Martingale convergence theorem (Doob). An -bounded martingale (or supermartingale) — — converges almost surely to an integrable limit. A non-negative supermartingale always converges a.s. (It may not converge in : the escaping-mass sequence, suitably arranged, is a non-negative martingale converging a.s. to zero with constant mean one.)
The workhorse for stochastic optimisation is a corollary:
Robbins–Siegmund (1971). Let be adapted with , and , a.s. Then converges a.s. to a finite limit and a.s.
Apply it to SGD on a function with -Lipschitz gradient, with and — a simplifying assumption, since it excludes even a strongly convex quadratic on ; the standard hypothesis is , and the argument below goes through with adjusted. A descent-lemma computation gives , which is Robbins–Siegmund with , , , . The condition is ; the conclusion together with forces , and with a little more work a.s. Those are the Robbins–Monro (1951) step-size conditions, and this is the proof under them — Bertsekas & Tsitsiklis (2000) and Bottou (1998) are the references. Measured on E2 under four schedules — one training stream per schedule, the error on a held-out set of points, whose binomial standard error at an error near is :
§21 SGD, logistic loss on E2 (d=20, mu=1), held-out error at t steps; Bayes risk 0.1587
step 1/t: t= 100 err=0.2457 t= 1000 err=0.2110 t=10000 err=0.1931 t=20000 err=0.1884
step 1/sqrt t: t= 100 err=0.1918 t= 1000 err=0.1652 t=10000 err=0.1614 t=20000 err=0.1608
step const 0.1: t= 100 err=0.1922 t= 1000 err=0.1864 t=10000 err=0.1749 t=20000 err=0.1830
step const 1.0: t= 100 err=0.2418 t= 1000 err=0.2199 t=10000 err=0.1818 t=20000 err=0.2760Read it against the theorem, because the theorem says less than it seems to and the table says what the theorem does not:
- satisfies Robbins–Monro and is the slowest. The conditions are about the limit, not the rate. With on a strongly convex with curvature at the optimum, the last iterate's expected squared distance to the optimum is only when ; below it, it is — for the distance itself — polynomially slow (Chung 1954; Nemirovski, Juditsky, Lan & Shapiro 2009). Averaging the iterates removes the dependence on only for the slower schedules with , which is Polyak–Juditsky. The theorem is silent on .
- violates and is the best at every horizon shown. In the convex case the averaged iterate's expected excess loss is under this schedule — a different theorem (the convex-optimisation bounds, with the averaging of Polyak & Juditsky (1992)); the table reports the last iterate's – error, against the Bayes risk , which is not that theorem's quantity but is not in tension with it — but means Robbins–Siegmund gives no almost-sure statement at all. What the schedule forgoes is the a.s. guarantee, not the limit; the a.s. guarantee is what the practitioner wanted.
- A constant step under persistent gradient noise does not converge almost surely, and the table illustrates it — four checkpoints cannot establish an asymptotic claim, so "illustrates" is the word: wanders between and after steps, diverges to at after touching . The claim is about the noise, not the step, and there are three regimes, each a one-line computation on the quadratic with . (a) Exact gradient, : , geometric convergence, trivially almost sure. (b) Additive noise, with i.i.d. of variance : is an AR(1) — the chain of §9.3 with innovation variance — whose stationary variance is : at , at , at for . The iterate converges in law to the stationary law of that AR(1) and almost surely to nothing — a floor of order , which is the E2 picture. The stationary law is Gaussian when is, as in §34; in general it is not, and the variance formula is all that survives: holds for any centred i.i.d. noise of finite variance and any , while at with the recursion is and the stationary law is the two-point law on , with the formula's variance and nothing Gaussian about it (§40(d)). (c) Noise that vanishes at the optimum, — the interpolation regime, in which every example's gradient is zero at : , so is a random walk with i.i.d. steps of mean , which is negative for a small and moderate noise, and the strong law makes almost surely at a geometric rate. A constant step does converge, almost surely, in this regime when that mean is negative — the contraction condition , which vanishing noise alone does not secure: at the mean is and the typical path diverges (§40(b)) — and almost surely is the mode the strong law delivers; whether goes to zero as well is a second, separate condition, and §40 below shows the two coming apart: almost-sure convergence does not imply convergence of the expected loss. §34 runs the three ( chains for (b) and (c)):
§34 Constant-step SGD on the noisy quadratic f(x) = x^2/2: exact gradient converges, additive noise leaves a floor alpha sigma^2/(2 - alpha), noise that vanishes at the optimum converges a.s. only under the contraction condition E log|1 - alpha(1+zeta)| < 0
(a) exact gradient, alpha=0.1: |x_10| = 1.7434e+00 (theory (1-alpha)^t * 5 = 1.7434e+00) |x_100| = 1.3281e-04 (theory (1-alpha)^t * 5 = 1.3281e-04) |x_1000| = 8.7394e-46 (theory (1-alpha)^t * 5 = 8.7394e-46)
(b) additive noise, alpha=0.5 : stationary var of x_t over the last 10,000 steps x 200 chains = 0.3333 (theory alpha/(2-alpha) = 0.3333; mean x_t +0.0002)
(SE of the line above: stationary var ± 0.0004 — SD across the 200 independent chains of each chain's own last-10,000-step variance, divided by sqrt(200))
(b) additive noise, alpha=0.1 : stationary var of x_t over the last 10,000 steps x 200 chains = 0.0526 (theory alpha/(2-alpha) = 0.0526; mean x_t -0.0005)
(SE of the line above: stationary var ± 0.0002 — SD across the 200 independent chains of each chain's own last-10,000-step variance, divided by sqrt(200))
(b) additive noise, alpha=0.01 : stationary var of x_t over the last 10,000 steps x 200 chains = 0.0050 (theory alpha/(2-alpha) = 0.0050; mean x_t +0.0011)
(SE of the line above: stationary var ± 0.0001 — SD across the 200 independent chains of each chain's own last-10,000-step variance, divided by sqrt(200))
(c) multiplicative noise, alpha=0.1, zeta sd 0.5: t= 100: median |x_t| = 1.169e-04 (log10 -3.93), 90th pct |x_t| = 2.297e-04 (log10 -3.64)
(c) multiplicative noise, alpha=0.1, zeta sd 0.5: t= 1000: median |x_t| = 2.447e-46 (log10 -45.61), 90th pct |x_t| = 2.036e-45 (log10 -44.69)
(c) multiplicative noise, alpha=0.1, zeta sd 0.5: t=10000: median |x_t| = 0.000e+00 (log10 -463.35), 90th pct |x_t| = 0.000e+00 (log10 -460.14)
(c) expected log-contraction E log|1 - alpha(1 + zeta)| = -0.1068 per step (MC over 2,000,000 draws; log(1-alpha) = -0.1054 without noise) -> |x_t| ~ 5 exp(-0.1068 t): noise that vanishes at the optimum converges a.s. only because this contraction condition E log|1 - alpha(1+zeta)| < 0 holds here (§40: zeta = ±20 makes it positive and the iterates diverge a.s.)
(SE of the line above: E log|1 - alpha(1 + zeta)| ± 0.0000 — sd/sqrt(n) from the same 2,000,000 draws; exact value by Gaussian quadrature -0.1069)Read against the closed forms: (a) is to five digits, as it must be; (b) lands on to four digits at every step size, a floor that a longer run does not lower; and (c) contracts at per step — slightly faster than the noiseless , since the noise enters through and not through — to by and underflow by . Same optimiser, same step, same landscape; the noise regime decides the mode.
The two modes in regime (c) are two different inequalities, and they can disagree. Keep and let the noise be with equal probability, so that the multiplier is or . Then , so is a random walk with negative drift and almost surely, at the rate on a typical path — while , so . Every path converges and the mean square diverges: the second moment is carried by the paths on which the came up more often than its share, which become rarer and larger without limit — the escaping mass of §5.1, inside an optimiser — and a finite average over seeds follows the typical paths, not the expectation, once the carrying paths are rarer than one in the number of seeds. Turn the noise up to : the multipliers are and , , and almost-sure convergence fails too; the typical path diverges. §40 runs both, and the Gaussian noise of §34(c) beside them, whose second moment satisfies both conditions:
§40 Multiplicative-noise SGD on f(x) = x^2/2: a.s. convergence with E[x_t^2] -> infinity, and the two exact contraction conditions
(a) zeta = ±5, alpha=0.1, x_0=1.0: multipliers 0.4 / 1.4; E log|m| = (1/2) ln(0.56) = -0.2899 < 0 (a.s. contraction) E[m^2] = (0.16 + 1.96)/2 = 1.06 > 1 (mean-square blow-up) [exact]
(a) 2,000 paths: t=50: median |x_t| = 5.07e-07, frac |x_t| < 1e-6 = 0.5510 t=100: median |x_t| = 2.57e-13, frac |x_t| < 1e-6 = 0.9945 t=200: median |x_t| = 6.59e-26, frac |x_t| < 1e-6 = 1.0000 (theory median ~ exp(-0.2899 t))
(SE of the line above: t=50: median within a factor exp(±0.000), frac ± 0.0111 t=100: median within a factor exp(±0.000), frac ± 0.0017 t=200: median within a factor exp(±0.000), frac ± 0.0000 — order-statistic SE of the median on the log scale and binomial SEs, from the same 2,000 paths)
(a) t=10: MC mean of x_t^2 over 2,000 paths = 1.210e+00 (exact E[x_t^2] = 1.06^10 = 1.791e+00; max path x_t^2 = 8.367e+02, median 3.033e-03 — the mean is carried by rare paths, so the MC mean undershoots the exact value once those paths are rarer than 1 in 2,000)
(SE of the line above: MC mean of x_t^2 ± 4.375e-01 — sd/sqrt(2,000) from the same paths; the exact SE, sqrt((E[m^4]^t - 1.06^(2t))/2,000) with E[m^4] = 1.9336, is 6.031e-01: the empirical SE understates by the same rare-path mechanism)
(a) t=20: MC mean of x_t^2 over 2,000 paths = 7.423e-01 (exact E[x_t^2] = 1.06^20 = 3.207e+00; max path x_t^2 = 3.808e+02, median 9.199e-06 — the mean is carried by rare paths, so the MC mean undershoots the exact value once those paths are rarer than 1 in 2,000)
(SE of the line above: MC mean of x_t^2 ± 3.325e-01 — sd/sqrt(2,000) from the same paths; the exact SE, sqrt((E[m^4]^t - 1.06^(2t))/2,000) with E[m^4] = 1.9336, is 1.634e+01: the empirical SE understates by the same rare-path mechanism)
(a) t=40: MC mean of x_t^2 over 2,000 paths = 8.662e-02 (exact E[x_t^2] = 1.06^40 = 1.029e+01; max path x_t^2 = 7.889e+01, median 8.463e-11 — the mean is carried by rare paths, so the MC mean undershoots the exact value once those paths are rarer than 1 in 2,000)
(SE of the line above: MC mean of x_t^2 ± 5.595e-02 — sd/sqrt(2,000) from the same paths; the exact SE, sqrt((E[m^4]^t - 1.06^(2t))/2,000) with E[m^4] = 1.9336, is 1.193e+04: the empirical SE understates by the same rare-path mechanism)
(b) zeta = ±20, alpha=0.1: multipliers -1.1 / 2.9; E log|m| = (1/2)(ln 1.1 + ln 2.9) = +0.5800 > 0; frac of 2,000 paths with |x_100| > 1e6 = 1.0000 (median |x_100| = 1.55e+25)
(SE of the line above: frac ± 0.0000 (binomial, from the same 2,000 paths: every path exceeded 1e6); median |x_100| within a factor exp(±0.000) (order-statistic SE on the log scale; exact median exp(100 E log|m|) = 1.55e+25))
(c) alpha=0.1: a.s. contraction iff E log|1 - alpha(1+zeta)| < 0; mean-square contraction iff E[(1 - alpha(1+zeta))^2] < 1 (no noise: log(1-alpha) = -0.1054, (1-alpha)^2 = 0.8100)
(c) zeta ~ N(0, 0.5^2) [§34(c)]: E log|m| = -0.1069 (a.s. converges) E[m^2] = 0.8125 (L2 converges)
(c) zeta ~ ±5 : E log|m| = -0.2899 (a.s. converges) E[m^2] = 1.0600 (L2 diverges )
(c) zeta ~ ±20 : E log|m| = +0.5800 (a.s. diverges ) E[m^2] = 4.8100 (L2 diverges )
(d) additive noise, alpha=1, xi = ±1, 10,000 steps from x_0=1.0: x_{t+1} = -xi_t; empirical support {-1, +1} with frequencies [0.4967, 0.5033] — a two-point law, not Gaussian (excess kurtosis -2.0 vs 0 for a Gaussian)
(SE of the line above: each frequency ± 0.0050 (binomial at p = 1/2, from the same 10,000 steps); the excess kurtosis -2 is exact for any ±1 sample (x^4 = x^2 = 1), no SE)
(d) stationary variance: empirical 1.0000 (theory alpha sigma^2/(2 - alpha) = 1 * 1/(2 - 1) = 1.0000 still holds — the formula fixes the variance, not the shape)
(SE of the line above: empirical variance ± 0.0001 — sqrt((m4 - s^4)/n) from the same 10,000 steps; for a ±1 sample s^2 = 1 - mean^2, so the SE is 2 |mean| sqrt(p(1-p)/n) up to O(1/n))Read §40 against the closed forms: the median tracks ( at ) and every one of paths is below by , while the Monte Carlo mean of falls below the exact — against at — because the paths that carry the second moment are by then rarer than one in : the sample average of a diverging expectation went down, exactly as a loss curve averaged over seeds would. At every path is past by . For the scalar multiplicative model the two conditions are exact, and this table is the whole theory:
| Mode | Exact condition for , i.i.d. | at |
|---|---|---|
| almost sure: a.s. | $\mathbb E\log | 1 - \alpha(1+\zeta) |
| mean square: | (independence, so the second moment multiplies step by step) | : fails |
Both conditions are exact for the scalar multiplicative model and neither is a characterisation of SGD: on a real objective the multiplier is a matrix that depends on , the noise is not i.i.d., and the two conditions become the two Lyapunov-type hypotheses — one on , one on — that a theorem for the full problem would have to supply. What transfers is the lesson: "converges almost surely" and "converges in mean square" are different claims with different hypotheses, the expected loss is a second-moment object, and it can diverge while every single run goes to zero.
The familiar "" belongs to regime (b) under strong convexity or the Polyak–Łojasiewicz condition: there the transient is in fact geometric, , so the quoted form holds and is loose, and the is the floor (Bottou, Curtis & Nocedal 2018, Thm 4.6; Karimi, Nutini & Schmidt 2016 for PL). For a merely convex objective the same shape holds for the averaged iterate; for a smooth non-convex one it holds for the run's average of and says nothing about at all. "Constant-step SGD converges" is therefore true in expectation to a neighbourhood of size under persistent noise, true almost surely when the noise vanishes at the optimum and the contraction condition holds — vanishing noise alone is not enough (: , almost-sure divergence, §40(b)), and almost-sure convergence does not imply convergence of the expected loss, which goes to zero in only under the second condition of the table above — and false as a.s. convergence in the first case. §5.1's table of modes (mode of convergence, §1.6 glossary) is exactly the distinction.
The regimes and the schedules together make a small table, and it is the place where the geometry of the objective enters the probability: convexity, strong convexity or PL change which quantity the theorem is about and in which mode it converges — that is the whole interaction between the landscape and the martingale, and beyond PL the piece does not go.
| Setting | Quantity the theorem is about | Mode and rate |
|---|---|---|
| Smooth non-convex, Robbins–Monro steps, bounded noise | and | almost surely: and converges, no rate (Robbins–Siegmund, above); not . With a constant step the statement is in expectation about the run's average of , (Bottou, Curtis & Nocedal 2018, Thm 4.8) |
| Convex / strongly convex, decreasing steps | or | in expectation, by schedule and averaging: for the averaged iterate at (convex); at with and below it (strongly convex) — the first two bullets |
| Constant step, noise persistent at the optimum — regime (b) | (strongly convex / PL) | in expectation, to a neighbourhood: floor plus a geometric transient; the iterate converges in law to a stationary distribution ( on the quadratic, Gaussian only when the noise is) and not almost surely |
| Constant step, noise vanishing at the optimum — regime (c), interpolation | (strongly convex / PL) | almost surely when $\mathbb E\log |
Every row of that table is about plain SGD, and the supermartingale in the proof is specific to it; the optimisers in use are not plain SGD. Adam's original convergence proof was wrong — Reddi, Kale & Kumar (2018) exhibit a convex problem on which Adam does not converge — and the repaired theorems (Défossez, Bottou, Bach & Usunier 2022) hold under their own hypotheses (bounded gradients, conditions on , and a bound on an average squared gradient norm rather than a.s. convergence). Momentum changes the state to and the Lyapunov function with it; gradient clipping changes the moments of the noise term; an adaptively collected data stream (RL, active learning, a curriculum chosen from the loss) can break the conditional unbiasedness that every line above used — importance reweighting by the adaptive sampling probabilities restores it, at the price of variance (§3.4's ESS); and a moving objective — a non-stationary data distribution, a target network, an adversary — removes the fixed the supermartingale descends. Each needs its own certificate, and the grade for "Robbins–Monro covers my optimiser" is not L1 but not covered until that certificate is produced.
So the honest statement is in three parts: under Robbins–Monro steps, Robbins–Siegmund gives a.s. convergence of and a.s. — not of the iterate , which needs more, such as isolated minima or convexity (L1, with no rate); rates are statements about expectations under schedules that may not satisfy Robbins–Monro (L1, different theorem); and a constant step converges only to a neighbourhood, in expectation, when the gradient noise persists at the optimum — and exactly, almost surely, when it vanishes there and the contraction condition holds — vanishing noise alone is not enough (: almost-sure divergence, §40(b)) — in only under the second condition of the §40 table, since almost-sure convergence does not imply convergence of the expected loss (L1 for both, and the table says which quantity each is about). Any sentence of the form "SGD converges" that does not say which of the three it means, and which noise regime it is in, is not yet a claim.
Theorem card — Robbins–Siegmund for SGD. Object: the non-negative adapted sequence along the SGD iterates, with the supermartingale inequality . Theorem: under , , conditionally unbiased gradients with a bounded second moment and an -Lipschitz gradient, converges and almost surely; no rate, and nothing about . Guarantee does not apply when: the step is constant (under persistent noise a floor, not convergence; under noise that vanishes at the optimum convergence almost surely only when the contraction condition holds — vanishing noise alone is not enough, diverges almost surely (§40(b)) — and in only under the second condition of the §40 table, since almost-sure convergence does not imply convergence of the expected loss), the gradient estimate is biased by adaptive data collection without reweighting, the objective moves, or the optimiser is not plain SGD (momentum, Adam and clipping each change the inequality). Counterexample: at a constant step the mode is decided by the noise, not the landscape — on at , multiplicative noise converges almost surely while (§40(a)); additive noise at converges in law to the two-point law , not to a Gaussian (§40(d)). Action: name the schedule, the noise regime, the quantity and the mode before saying "converges"; establish a floor by running longer at the same step, not by reading four checkpoints.
Diagnostic exercise C. A colleague runs constant-step SGD at on two problems, sees the loss settle at a nonzero value on the first and go to zero on the second, and concludes "constant-step SGD converges on the second problem and not on the first, so the theorem must assume something about the loss landscape". Construct the two problems so that the landscapes are identical, and diagnose the conclusion. (Take for both. First problem: the gradient oracle returns with — noise that persists at the optimum — so is the AR(1) of §34(b) with stationary variance , the loss settles near , and the iterate converges in law and not almost surely. Second problem: the oracle returns — noise proportional to the gradient, vanishing at — so is a random walk with drift , and almost surely when that drift is negative — the contraction condition, which §34(c)'s Gaussian noise satisfies (, §40(c)) and does not (, almost-sure divergence, §40(b)): vanishing noise alone is not enough — and in only under the second condition, , which §34(c)'s Gaussian noise satisfies () and §40's noise does not, so almost-sure convergence does not imply convergence of the expected loss (§34(c), §40). Same landscape, same step, same optimiser; the difference is whether the noise variance is zero at the optimum, a property of the data (interpolation), not of the loss surface. The conclusion attributed to geometry a fact about the noise, and "the theorem" — Robbins–Siegmund — was never in play, since a constant step violates .)
Where the geometry of the loss enters, and how little of it is a theorem (L3). On a quadratic with positive definite the full-batch iteration is , and it converges to the unique minimiser from every initialisation if and only if (the spectral radius of is below one exactly then) — the stability threshold, the one theorem in this paragraph, and the reason "sharpness", the largest Hessian eigenvalue, is the quantity people measure. Cohen, Kaur, Li, Kolter & Talwalkar (2021) observed that full-batch gradient descent on real networks drives up to the threshold and then trains at it, with the loss falling non-monotonically — the "edge of stability" — which is an empirical regularity located at exactly the quadratic's threshold and not a consequence of any theorem above, since the quadratic model predicts divergence there, not a plateau. The claim that SGD's noise is a regulariser that prefers flat minima is L3 in the same way, and it has one computable piece: the §34(b) AR(1), whose stationary variance on the quadratic is with the gradient-noise variance — for a minibatch of , so the stationary variance of the iterate scales as for small (its standard deviation as ) on this quadratic (Mandt, Hoffman & Blei 2017 read that scaling as a temperature) — and the step from "a wider stationary cloud in the directions of small curvature" to "the minimum found generalises better" is not a theorem here or, as far as we know, anywhere; §7.5's grade for "this is why deep networks generalise" applies verbatim.
8.5 The likelihood-ratio martingale, Wald, and the exponents of the earlier piece
Martingale 3 of §8.1 — the likelihood ratio under the null — is a non-negative martingale with mean one, so Ville's inequality gives : the sequential probability ratio test (Wald 1945), which stops when leaves . Two claims sit here and they are different theorems: Ville's says the type-I error is controlled under every stopping rule, the SPRT's own included; that the SPRT also has the smallest expected sample size among all tests with its two error rates is the separate optimality theorem of Wald & Wolfowitz (1948).
The expected sample size under each hypothesis is governed by the KL divergences and , and the step from the test to the sample size uses a second martingale, not the first. is the martingale, for Ville; is not one — under its increments have mean , so it is a random walk with negative drift — and the object that is a martingale is the centred sum , provided the increments are integrable, . Optional stopping applied to , under (with bounded increments, or Wald's own integrability condition), gives Wald's identity ; since the SPRT stops with near or , that solves for in terms of the two error rates and the KL. Two objects, then: , the non-negative test martingale that controls the error, and , the centred additive martingale that prices the sample size. Those KLs are the two KL divergences our Information Domain piece's §9.3 computed at fixed — Stein's exponent and its reverse — not the Chernoff information of that piece, which is a KL to a tilted third distribution. The fixed-sample exponents are the rate at which error falls per sample; the sequential version converts that rate into an expected number of samples per decision, and the conversion is a martingale identity. L1.
Checkpoint exercise 8. With the test martingale of §8.2 at and a threshold of (), what does Ville guarantee? If the coin actually has , what is the expected growth rate per sample of the branch, and roughly how many samples until it crosses ? (Ville: under the null, for every stopping rule. Growth: nats per sample — negative: is too aggressive a bet for a coin and the martingale shrinks. The Kelly-optimal gives nats per sample, so about samples for the one-sided branch, and somewhat more for the two-sided mixture, whose factor of costs another . The bet has to match the alternative; that is the power cost of anytime validity.)
9. Markov chains, ergodicity, and Monte Carlo
Not on the fast path. The practical destinations — the eval error bar (§7.6) and the SGD claim (§8.4) — do not depend on this section; it supplies the ergodic theorem behind every Monte Carlo average taken along a chain and the effective sample size that extends the eval error bar to dependent units (§9.1), the gap between ergodic and useful (§9.2), Langevin sampling and the bias of its discretisation (§9.3), the time reversal a diffusion model is a theorem about (§9.4), and the conditions under which an RL rollout is an estimate (§9.5).
9.1 The Markov property, and three theorems about one long run
A sequence is a Markov chain if the future is conditionally independent of the past given the present: . In §1.3's vocabulary, the σ-algebra carries all the information in that is relevant to the future. A stationary distribution satisfies : start there and stay there in law. Three theorems, with different hypotheses, about what one long trajectory of such a chain tells you:
- Convergence theorem. If the chain is irreducible (every state reachable from every other), aperiodic and positive recurrent, it has a unique stationary and from every start . The marginal at time forgets the start.
- Ergodic theorem for Markov chains. If the chain is irreducible and positive recurrent (aperiodicity not needed), then for every with , a.s. from every start. The time average equals the space average. This is the strong law for a dependent sequence, and it is what every MCMC estimate and every long-rollout evaluation rests on. On a general state space — every worked chain below lives on — read "irreducible, positive recurrent" in these two theorems as ψ-irreducible and positive Harris recurrent (Meyn & Tweedie, Markov Chains and Stochastic Stability, Thms 13.0.1 and 17.1.7); the AR(1), Metropolis–Hastings and Langevin chains below are.
- Markov-chain CLT. Under a mixing condition (geometric ergodicity suffices; it is not necessary) and , with The autocorrelations are the price of dependence, and the effective sample size is the number of independent draws the run is worth. It can exceed : under negative autocorrelation — antithetic draws, or the AR(1) below with — the covariance sum is negative, , and at the closed form gives ; dependence is a correction in either direction, and the positively correlated case, which is the usual one for a chain, is the one that costs.
The general version of the middle theorem is Birkhoff's ergodic theorem (1931): for a measure-preserving transformation on a probability space (the sample space, §1.6 glossary) and every , a.s., where is the σ-algebra of -invariant events; the system is ergodic when is trivial, and then the limit is . Ergodicity is weaker than mixing — rotation of the circle by an irrational angle is ergodic (time averages converge) but not mixing (the marginal never forgets its start, since the map is deterministic) — which is why the ergodic theorem does not need aperiodicity and the convergence theorem does. The ergodic hypothesis of statistical mechanics, that a single trajectory of a gas samples the microcanonical ensemble, is this theorem's physical ancestor (Appendix B).
On E4, the AR(1) chain with unit stationary variance, the autocorrelations are and the sum is in closed form, for :
§23 AR(1), phi = 0.9, n = 10,000, 2,000 independent runs
var(time average) * n = 19.906; theory (1+phi)/(1-phi) = 19.000; ESS = n*(1-phi)/(1+phi) = 526 of 10000
(SE of the line above: var(time average) * n ± 0.614 — sqrt((m4 - s^4)/reps) x n from the same 2,000 independent replicated time averages)Ten thousand correlated draws are worth independent ones, and a standard error computed as if they were independent is times too small. That inflation factor is the number to compute before quoting a Monte Carlo error bar from a chain, and it is what the MCMC error diagnostics (integrated autocorrelation time, batch means) estimate; is a different check — that parallel chains agree with each other — not an estimate of this ratio. L1.
Action changed. Report the effective sample size beside for every Monte Carlo number drawn from a chain or a dependent stream, and build the interval on the ESS: an interval built on the raw is wrong by the inflation factor — too narrow at (§23), at (exercise 9) — and a per-token error bar on a document stream is the same mistake with the same fix (§7.6, assumption 1).
Two effective sample sizes share a name and nothing else: the importance-sampling ESS of §3.4, , measures the weight degeneracy of independent draws, and is a diagnostic of the proposal rather than the denominator of any estimate's standard error — its fraction of tends to for a Gaussian target shifted by from the proposal — while the ESS here measures the autocorrelation of dependent, equally weighted draws, for the AR(1); and neither guarantees a valid interval under heavy-tailed weights or poor mixing, because each is estimated from the very run whose quality is in question:
§36 Two effective sample sizes that share a name: importance-sampling ESS (sum w)^2 / sum w^2 vs Markov-chain ESS n / (1 + 2 sum rho_k)
(a) IS, target N(0.5,1) from N(0,1), n=10,000: ESS = 7824.6, ESS/n = 0.7825 (theory limit E[w]^2/E[w^2] = exp(-mu^2) = 0.7788; max weight share 0.0006)
(SE of the line above: ESS/n ± 0.0039, ESS ± 39.1 — delta method on (mean w)^2 / mean w^2 from the same n = 10,000 weights; at mu >= 2 the weights are heavy-tailed and this SE is itself unreliable, cf. §48)
(a) IS, target N(1.0,1) from N(0,1), n=10,000: ESS = 3737.7, ESS/n = 0.3738 (theory limit E[w]^2/E[w^2] = exp(-mu^2) = 0.3679; max weight share 0.0025)
(a) IS, target N(2.0,1) from N(0,1), n=10,000: ESS = 325.1, ESS/n = 0.0325 (theory limit E[w]^2/E[w^2] = exp(-mu^2) = 0.0183; max weight share 0.0229)
(a) IS, target N(3.0,1) from N(0,1), n=10,000: ESS = 46.9, ESS/n = 0.0047 (theory limit E[w]^2/E[w^2] = exp(-mu^2) = 0.0001; max weight share 0.0848)
(b) AR(1) phi=0.5 , n=10,000: theory ESS = n(1-phi)/(1+phi) = 3333.3; empirical (rho_k summed to lag 10, first rho_k < 0.01) tau = 3.3, ESS = n/tau = 3076.7
(SE of the line above: tau ± 0.2, ESS = n/tau ± 199.4 — Sokal's asymptotic Var(tau_hat) ~ 2(2K + 1) tau^2/n with the window K = 10, from the same chain)
(b) AR(1) phi=0.9 , n=10,000: theory ESS = n(1-phi)/(1+phi) = 526.3; empirical (rho_k summed to lag 29, first rho_k < 0.01) tau = 17.9, ESS = n/tau = 557.9
(SE of the line above: tau ± 1.9, ESS = n/tau ± 60.6 — Sokal's asymptotic Var(tau_hat) ~ 2(2K + 1) tau^2/n with the window K = 29, from the same chain)
(b) AR(1) phi=0.99, n=10,000: theory ESS = n(1-phi)/(1+phi) = 50.3; empirical (rho_k summed to lag 376, first rho_k < 0.01) tau = 169.3, ESS = n/tau = 59.1
(SE of the line above: tau ± 65.7, ESS = n/tau ± 22.9 — Sokal's asymptotic Var(tau_hat) ~ 2(2K + 1) tau^2/n with the window K = 376, from the same chain)The IS line shows the warning in the act: at and the measured fraction (, ) sits well above its limit (, ), because ten thousand draws have not yet seen the heavy tail of the weights — a single weight carries of the total at — so the ESS estimate is optimistic exactly when it matters. The AR(1) line is the §23 number again, with the autocorrelation sum truncated where drops below , which is one reason the empirical ESS at () overshoots the exact — truncating a sum of positive autocorrelations biases down and the ESS up — while the estimated carry their own noise, which is why the line undershoots instead.
is the long-run variance of the stream, and it is estimable without a model for the autocorrelation: batch means (split the run into blocks, take the variance of the block means times the block length) and the block bootstrap (Künsch 1989), which resamples contiguous blocks so that the within-block dependence is kept, both estimate it — Markov or not — for a stream that is stationary and ergodic, with autocorrelations summable under a mixing condition, a moment for , and a block length that grows with the run while ; stationarity alone is not enough, and the cleanest case in the piece says why. Draw a fair coin once and set for every . The marginal law is at every — stationary — but the sample mean of a trajectory is , never , its variance across trajectories is at every , and from a single trajectory both batch means and the block bootstrap report a variance of exactly zero, because every block is the same constant (§45):
§45 Stationary but not ergodic: a latent fair coin Z, X_t = Z for every t
1,000 trajectories x T = 1,000 steps: per-trajectory sample mean takes the value 0 in 0.488 of trajectories, 1 in 0.512, exactly 1/2 in 0.000 (marginal law of X_t is Bernoulli(1/2) at every t: stationary ✓)
(SE of the line above: each fraction ± 0.016 — binomial at p = 1/2 from the same 1,000 trajectories)
variance of the sample mean across trajectories: empirical 0.2501 (theory 1/4 = 0.2500; an ergodic iid Bernoulli(1/2) chain would give 1/(4T) = 0.00025) -> time average != ensemble average: ergodic ✗
(SE of the line above: empirical variance ± 0.0004 — sqrt((m4 - s^4)/R) from the same 1,000 trajectory means)
from ONE trajectory (Z = 1): block-bootstrap variance estimate (block length 50, 200 resamples) = 0.0000; batch-means estimate (20 batches of 50) = 0.0000 (truth 1/4)
stationary ✓, ergodic ✗: both one-trajectory estimators report zero — no amount of T or resampling reveals the latent coin from a single pathThe variance of the time average across trajectories is against the truth — an ergodic i.i.d. coin would give — and the one-trajectory block bootstrap and batch means both return . The chain is stationary and not ergodic — its invariant σ-algebra contains — and no estimator computed from one path can tell, however long the path or however many resamples; the remedy is structural, several independent starts, which is the check in its proper role. That is the estimator to reach for whenever the units are dependent and the quantity is a time average. A per-token loss over a document is exactly such a stream, and §7.6's first assumption — independence among the test examples — fails in exactly the way the AR(1) factor describes: the error bar on a token-level average must be inflated by the same , or computed on the independent units, the documents.
The failure mode on the other side is the CLT's own hypothesis. The CLT needs a mixing-and-moment condition, and geometric ergodicity with is one sufficient set, not the only one — polynomial ergodicity with correspondingly more moments on is another (Jones 2004) — so a chain that is not geometrically ergodic has not thereby lost its CLT; what loses it is a heavy-tailed target, or a chain that mixes slowly enough that the autocorrelations are not summable, and then the Markov-chain CLT can fail outright, is infinite or undefined, and an ESS estimated from the empirical autocorrelations of a finite run is a number with no theorem behind it. The numbers above are exact for the AR(1) because that chain is geometrically ergodic and is in , both of which are things to check rather than assume.
Theorem card — Markov-chain CLT and the ESS. Object: the time average of a function along one run of a ψ-irreducible, positive Harris chain. Theorem: under geometric ergodicity and , with the long-run variance, and . Guarantee does not apply when: the chain is not known to satisfy a mixing-and-moment condition that supports a CLT — geometric ergodicity with is one sufficient set, and heavy tails or metastability (§9.2) are the usual ways to lose it; polynomial ergodicity with more moments on is another — the run is shorter than the mixing time (the ESS is then estimated from a sample that has not yet seen the chain's dependence), the stream is stationary but not ergodic, or the ESS quoted is §3.4's importance-sampling one. Counterexample: the latent-coin chain (§45) — stationary, with every one-trajectory variance estimate equal to zero and the true variance of the time average . Action: quote a Monte Carlo error bar from a chain only with the long-run variance (batch means, block bootstrap) and the ESS beside it; run parallel chains for as the separate check that they agree.
A finite long-run variance is not, on its own, a CLT, and the counterexample is one step past §45's coin. Draw once with probability each and set with i.i.d. standard Gaussian : the stream is stationary with mean , variance and autocovariances exactly zero — for — so its long-run variance is ; yet at every , a scale mixture and not . The process is not ergodic (the event is invariant), zero autocorrelation does not cure it, and a batch-means estimate from one run returns , never . A nominal interval of half-width misses with probability , not — too wide on the runs and too narrow on the ones, and wrong in shape on both. The moral is L1: a Gaussian error bar on a dependent stream needs a CLT established for the process — ergodicity or mixing plus a moment condition — and the long-run variance is the variance in that CLT, not a substitute for it (§13's assumption map, second row).
§50 A finite long-run variance is not a CLT: X_t = V eps_t with V in {1, 2} drawn once per run, eps_t iid N(0,1)
(a) exact: Var X_t = E V^2 = 2.5000; Cov(X_s, X_t) = E[V^2] E[eps_s] E[eps_t] = 0 for s != t; long-run variance sum_k Cov(X_0, X_k) = 2.5000 (finite, and the sample autocorrelations are 0 at every lag)
(a) but sqrt(n) Xbar_n = V (1/sqrt(n)) sum eps_t =d V Z exactly at every n: the law is the scale mixture (1/2) N(0,1) + (1/2) N(0,4), not N(0, 2.5); its excess kurtosis is E[(VZ)^4]/(E[(VZ)^2])^2 - 3 = 25.5/6.25 - 3 = 1.0800
(a) the nominal-95% interval Xbar +- 1.96 sqrt(2.5)/sqrt(n) misses 0 with exact probability (1/2) P(|Z| > 1.96 sqrt(2.5)) + (1/2) P(|Z| > 1.96 sqrt(2.5)/2) = (1/2)(0.0019) + (1/2)(0.1213) = 0.0616 (nominal 0.0500)
(b) simulated, R = 20,000 runs of n = 1,000 with g50: fraction of runs with V = 1: 0.5069 (binomial SE 0.0035; exact 0.5000)
(b) sample autocorrelation pooled across runs: lag 1: -0.00059 ± 0.00023, lag 2: -0.00095 ± 0.00022, lag 3: -0.00092 ± 0.00022 (exact 0 at every lag; the finite-n bias of the estimator is -1/n = -0.00100)
(b) variance of sqrt(n) Xbar_n across runs: 2.4931 (SE 0.0311) vs the long-run variance 2.5000: the variance is right
(b) excess kurtosis of sqrt(n) Xbar_n across runs: +1.1091 (delete-one jackknife SE 0.0745) vs the exact scale-mixture value +1.0800 (a Gaussian limit would give 0): the shape is not
(b) fraction of runs where the nominal-95% interval misses 0: 0.0595 (binomial SE 0.0017) vs exact 0.0616 from (a), nominal 0.0500
(c) batch-means long-run-variance estimate from within each run (20 batches of 50): among the 10,138 runs with V = 1: mean 1.0043 (SE 0.0033), 5th-95th pct 0.531-1.610 (it estimates V^2 = 1, the run's own conditional variance)
(c) batch-means long-run-variance estimate from within each run (20 batches of 50): among the 9,862 runs with V = 2: mean 3.9996 (SE 0.0131), 5th-95th pct 2.160-6.315 (it estimates V^2 = 4, the run's own conditional variance)
(c) the mean of the estimate over all runs is 2.4813 (SE 0.0125) = E V^2 = 2.5, but the fraction of runs whose estimate lies within 10% of 2.5 ([2.25, 2.75]) is 0.0518: no single run sees the long-run variance 2.5 — the within-run estimator cannot average over V, which is drawn once§50 prints this example: the moments and autocovariances, the law of against , the one-run batch-means estimates, and the miss rate of the nominal interval.
9.2 Detailed balance, Metropolis–Hastings, and the gap between ergodic and useful
A chain is reversible with respect to if — detailed balance — and detailed balance implies stationarity by summing over . Metropolis–Hastings builds a reversible chain for any target known up to a constant: propose , accept with probability , otherwise stay. The acceptance ratio is exactly what makes detailed balance hold, and the normalising constant of cancels.
Ergodicity is a property of the Metropolis–Hastings kernel, not of the proposal alone: when the proposal can reach every set of positive -mass — a Gaussian random walk does, for any target with a density on — the chain is -irreducible, and when rejection happens with positive probability it is aperiodic, since the chain can stay where it is; a -irreducible Metropolis–Hastings chain is then Harris recurrent (Tierney 1994, Cor. 2), so the convergence theorem holds from every start and the ergodic theorem licenses the time average — provided the proposal does reach the target's support, since a proposal that cannot cross between two components of that support leaves a reducible chain whatever its own irreducibility. What the theorems do not license is any particular rate:
§24 Metropolis–Hastings for N(0,1), Gaussian random-walk proposal, 200,000 steps
step= 0.1: acceptance 0.968, integrated autocorrelation time ~ 336.3, ESS per 10^4 draws ~ 30
step= 0.5: acceptance 0.844, integrated autocorrelation time ~ 25.1, ESS per 10^4 draws ~ 399
step= 2.4: acceptance 0.442, integrated autocorrelation time ~ 4.3, ESS per 10^4 draws ~ 2314
step=10.0: acceptance 0.126, integrated autocorrelation time ~ 11.3, ESS per 10^4 draws ~ 884All four chains are ergodic with the same stationary law. The one with the highest acceptance rate is the worst by a factor of in effective samples, because it moves in tiny steps; the one that accepts is best, which is the one-dimensional case of Roberts, Gelman & Gilks (1997)'s optimal-scaling result (the asymptotic optimum in high dimension is an acceptance rate of ).
The gap between the four is a property of the spectral gap of the transition operator: for a reversible chain the integrated autocorrelation time of the slowest mode is , and the mixing time scales as times a log factor. For a multimodal target with a barrier of height between modes, the spectral gap of a local proposal is of order — for a proposal whose steps are small against the barrier width, in the low-temperature regime where is large, with the barrier height of and a prefactor that is sub-exponential in : the Eyring–Kramers asymptotics, not a formula for an arbitrary proposal — proved for reversible chains by Bovier, Eckhoff, Gayrard & Klein (2002, Comm. Math. Phys. 228) and for the diffusion of §9.3 by the same authors (2004) — ergodic in theory, with a time average that converges, and stuck in practice for longer than any run.
This is the precise sense in which "the sampler is ergodic" guarantees nothing you can use: the theorem has no rate, and the rate can be exponentially bad. It is also the honest explanation of why diffusion models (§9.4) displaced MCMC for sampling images: they do not run an ergodic chain to equilibrium at all, they integrate a time-reversal with a fixed horizon, and no mixing time enters.
9.3 Langevin dynamics: the continuous chain, its stationary law, and the bias of its discretisation
The Langevin diffusion for a potential ,
has the stationary law : its Fokker–Planck equation has as a stationary solution, and under mild conditions on the law of converges to it. The Ornstein–Uhlenbeck case is E4 in continuous time — sampling it at intervals gives the AR(1) with — and the general case is the sampler behind SGLD, score-based models and much of modern Bayesian deep learning. The discretisation that everyone runs, the unadjusted Langevin algorithm , is a Markov chain whose stationary law is not :
§25 ULA for N(0,1): x <- x - h x + sqrt(2h) xi has stationary variance 1/(1 - h/2), not 1
h=0.01 : measured stationary var 1.0056 theory 1/(1-h/2) = 1.0050
(SE of the line above: measured stationary var ± 0.0106 — batch means, 100 batches of 19,980 steps of the same chain; AR(1) asymptotic sqrt((2/n)(1 + rho^2)/(1 - rho^2)) x var with rho = 1 - h: 0.0100)
h=0.1 : measured stationary var 1.0595 theory 1/(1-h/2) = 1.0526
(SE of the line above: measured stationary var ± 0.0073 — batch means, 100 batches of 3,998 steps of the same chain; AR(1) asymptotic sqrt((2/n)(1 + rho^2)/(1 - rho^2)) x var with rho = 1 - h: 0.0073)
h=0.5 : measured stationary var 1.3317 theory 1/(1-h/2) = 1.3333
(SE of the line above: measured stationary var ± 0.0040 — batch means, 100 batches of 3,999 steps of the same chain; AR(1) asymptotic sqrt((2/n)(1 + rho^2)/(1 - rho^2)) x var with rho = 1 - h: 0.0038)
h=1.0 : measured stationary var 2.0043 theory 1/(1-h/2) = 2.0000
(SE of the line above: measured stationary var ± 0.0047 — batch means, 100 batches of 3,999 steps of the same chain; AR(1) asymptotic sqrt((2/n)(1 + rho^2)/(1 - rho^2)) x var with rho = 1 - h: 0.0045)The chain is the AR(1) with and innovation variance , whose stationary variance is — exact, and too wide at (the measured values are single runs of steps at and at the other three, after a burn-in of steps). The bias is for this Gaussian; for a general strongly log-concave target the guaranteed bound is in (Durmus & Moulines 2017), and needs more smoothness (a Lipschitz Hessian). Either way it does not average away with longer runs; it is removed either by a Metropolis correction (MALA, which makes the chain exactly reversible for at the cost of rejections) or by decreasing the step, which is what Welling & Teh (2011)'s SGLD does with a Robbins–Monro schedule.
That the time average of a decreasing-step SGLD run is consistent for is not §8.4's theorem, which is about an iterate converging to a root; it is Teh, Thiéry & Vollmer (JMLR 2016), with the stochastic gradient's noise absorbed into the injected noise at a rate the schedule has to respect. L1 for the Gaussian computation above; the general-target bias and the SGLD consistency are theorems with their own hypotheses, quoted here and not derived.
Sampling is optimisation in the space of densities. Jordan, Kinderlehrer & Otto (1998) showed that the Fokker–Planck flow is the gradient flow of the free energy — which is up to a constant — with respect to the Wasserstein-2 metric on densities: the law of the Langevin diffusion descends the KL to the target as steeply as the geometry of optimal transport allows. That is the sense in which "density optimisation" is a literal description of a sampler, and it is exact for the continuous-time flow (L1); the discrete algorithms are time-steppings of it, and the slogan "Langevin is gradient descent on KL" is L2 at the step sizes anyone uses. The quantity the flow is driven by is , the score, and that is the object the next subsection learns.
9.4 Time reversal, and what a diffusion model is a theorem about
Run the Ornstein–Uhlenbeck process forward from a data law (the pushforward law of , §1.6 glossary) for time : , so that and the law is close to for large . Our probabilistic-3D piece described the reverse process heuristically; the theorem is:
Anderson (1982). The time reversal of the diffusion is itself a diffusion,
driven by the score of the forward marginals. Nothing is approximated: start , integrate with the exact score, and .
§26 forward OU from a two-point law {-2 w.p. 0.3, +2 w.p. 0.7}, T = 3; reverse with the exact score, 3,000 Euler steps, 100,000 particles
mass at x<0 = 0.3022 (target 0.300), mean of x>0 group = 2.000 (target 2.0), sd 0.045 (noise of the last Euler step, sqrt(2 dt) = 0.045; exact target 0 at t = 0)
(SE of the line above, from the same 100,000 paths: mass at x<0 ± 0.0015 (binomial); mean of the x>0 group ± 0.0002 (sd/sqrt(69,781)); the mass is 1.5 SE from 0.300 and the mean 1.4 SE from 2.0)The reversal recovers the mixture weights to within their Monte Carlo error ( against , standard error at particles) and the modes to three digits from particles that started as — a centred Gaussian with 's component variance, standing in for the stationary , not the exact , whose two means sit at . The spread of is the Euler error of the last step: the loop steps through to , where the exact reversal would collapse each component to a point, but one Euler step of the singular drift leaves the of noise it injects (the printed mean is , not 's , so the particles do sit at ); it shrinks as , and a sampler that stops at instead, as practical ones do, would show the same width as the exact spread of , .
The finite-horizon mismatch is a third error term, and the first bullet below names it. The learned part of a diffusion model is the score , estimated by denoising score matching, and Song et al. (2021) is this theorem with a neural network in the drift. Two more levels of the same object, each with its label:
-
The training objective is a KL between path measures (L1), and it bounds the likelihood only in expectation. Song, Durkan, Murray & Ermon (2021) prove three different statements. By Girsanov's theorem — the Radon–Nikodym derivative (§1.6 glossary) between the laws of two diffusions with different drifts and the same noise, which is §2.2 on path space — the KL from the true reverse process to the model's is the score-matching error integrated with the likelihood weighting , , plus the finite-horizon term for starting the reversal at rather than . Data processing carries that to the time-zero marginal, (their Theorem 1), and §4.2's cross-entropy identity turns it into a bound on the expected negative log-likelihood. The denoising loss under that weighting is up to a constant free of ; the other weightings in common use are not bounds, and the same paper is where that line is drawn.
The per-sample bound on (their Theorem 3) is a separate variational bound — of §3.5's kind, with the "" a measure on paths — and has terms of its own: the prior's log-density at the endpoint and a time integral of the model score's norm and divergence. It is not the path-space KL, which with the exact score and is zero while is in general not. And the §26 target has no density: its two atoms make mutually singular to any model endpoint with a density (§2.4), so neither the path-space KL nor is finite. A finite bound needs the model endpoint — start at , add observation noise, or dequantise (§2.2); §26 checks the reversal, not the bound. L1 for the three statements and for the singularity.
-
Why it trains well, and why a given schedule is good (L3). The theorem licenses the objective and says nothing about the optimisation landscape; our Information Domain piece's §7 read the same forward process as an information-destruction schedule and graded that a diagnostic, not a prescription. The two pieces agree on the level.
-
Two grades for one theorem (L1 / not inherited). Anderson's reversal is L1 — exact, with the exact score and the continuous-time integral. A trained score network and an Euler discretisation do not inherit it: the sampler that actually runs is a different object with three error terms — the score-estimation error (controlled in expectation by the Girsanov bound above, for the loss actually trained), the discretisation error (the above), and the finite-horizon term — and the theorem grades none of them. "The learned score is close enough" is L3 until the held-out score-matching loss is measured.
Action changed. When a diffusion sampler is off, do not treat "the model is wrong" as one claim: diagnose the three terms separately — the held-out denoising loss under the likelihood weighting for the score, a halved step for the discretisation (the §26 spread shrank as in that singular-endpoint experiment; the textbook Euler–Maruyama rates — strong order , weak order — assume Lipschitz coefficients that a sampler's endpoint score violates, so measure the rate on your sampler rather than assume it), and a longer or the exact for the horizon — and fix the one that moves.
The last callback is to that piece's §9.1. The asymptotic equipartition property — that converges to the entropy rate — was stated there for i.i.d. sources via the strong law. The Shannon–McMillan–Breiman theorem extends it to every stationary ergodic source, with almost-sure convergence. For a stationary ergodic Markov chain the proof is the ergodic theorem of §9.1 and nothing more: , the increments are themselves a stationary ergodic sequence, and Birkhoff gives the entropy rate directly — E4's AR(1), whose entropy rate is , is that computation.
For a general stationary ergodic source the finite-history increments are not stationary (each sees a different length of past), Birkhoff does not apply to them as they stand, and the proof (Breiman 1957) sandwiches them between the increments conditioned on past symbols and on the infinite past, each of which is stationary, and lets . The typical set of a language model's own distribution — a stationary ergodic process only under assumptions the model's context window may violate — is that theorem's object, with that caveat attached.
9.5 Reinforcement learning's stationary distribution, and when one rollout is not an estimate
A policy in an MDP induces a Markov chain on states, and the policy gradient theorem comes in two formulations that are two theorems about two objects, not one object with two names. Discounted: for from a fixed start distribution,
where the prefactor is there because has been normalised to a probability: absorb it by defining with a in front, or leave unnormalised, and it disappears — one of the three must be done, and dropping the factor while keeping the normalised is off by , a factor of at . Average-reward: for ,
with the stationary law of the induced chain and the differential action value, the return measured against the long-run average (Sutton & Barto, §13.2 and §13.6). The differential value is defined by the average-reward Poisson (Bellman) equation, and , which for a finite irreducible chain has a solution unique up to an additive constant, periodic chains included. The other representation of that solution is a limit of expected finite-horizon sums, , valid when the limit exists — aperiodicity suffices for a finite chain, since then converges geometrically — or as a Cesàro limit otherwise; it is not valid in general, and it is not the expectation of a convergent series , because the random partial sums need not converge even when their expectations do. The deterministic alternation with , has stationary law and , its centred partial sums from state are and have no limit, while its Poisson equation has the solution ; and the chain that mixes in one step, with the same rewards, has for every — the limit of expectations exists — while along every path the increments after the first step are forever, so is a simple random walk and the series converges on no path at all (§51). The first formulation needs no ergodicity; the second needs the stationary law to exist — irreducibility and positive recurrence give it, which is the second bullet's condition below — and it does not need the time- law to converge to that stationary law: a periodic chain's time- law oscillates forever while its time average still converges, which is exactly the gap between §9.1's convergence theorem and its ergodic theorem.
§51 The differential value's infinite sum need not converge: the alternating two-state chain P = [[0,1],[1,0]], r = (1, -1)
(a) stationary law pi = [0.5, 0.5] (left eigenvector of P at eigenvalue 1), gain J = pi . r = +0.0000; period 2: eigenvalues of P are [-1.0, 1.0]
(a) centred partial sums S_t = sum_(k=0)^t (E_0 r(X_k) - J) from state 0, t = 0..9: [1, 0, 1, 0, 1, 0, 1, 0, 1, 0] — the sequence alternates 1, 0, 1, 0, ... and never converges
(a) Cesaro average (1/T) sum_(t<T) S_t: T = 10: 0.5000, T = 100: 0.5000, T = 1000: 0.5000 -> 0.5, the Cesaro limit exists although the sum does not
(a) Poisson equation h = r - J + P h with h(1) = 0: h = [1.0, 0.0], h(0) = 1.0000; residual ||(I - P) h - (r - J)||_inf = 0.0e+00 — h exists and is unique up to constants even though the series for it diverges
(a) time-t law from state 0 and its TV distance to pi: t = 0: [1.0, 0.0] TV 0.5000, t = 1: [0.0, 1.0] TV 0.5000, t = 2: [1.0, 0.0] TV 0.5000, t = 3: [0.0, 1.0] TV 0.5000, t = 4: [1.0, 0.0] TV 0.5000, t = 5: [0.0, 1.0] TV 0.5000 (TV = 0.5 at every t: the chain never mixes)
(a) time-average occupation (1/T) sum_(t<T) P^t(0, .) and its TV distance to pi: T = 10: TV 0.0000, T = 11: TV 0.0455, T = 1000: TV 0.0000, T = 1001: TV 0.0005 (-> 0: the time average converges although the time-t law does not)
(b) aperiodic contrast P = [[0.9, 0.1], [0.1, 0.9]], same r: pi = [0.5, 0.5], J = +0.0000, second eigenvalue 0.8; partial sums from state 0: t = 0: 1.0000, t = 10: 4.5705, t = 50: 4.9999 (E_0 r(X_k) - J = 0.8^k, so S_t = (1 - 0.8^(t+1))/0.2 -> 5.0000)
(b) Poisson solution with h(1) = 0: h = [10.0, 0.0]; h(0) - h(1) = 10.0000 [algebra: h(0) - h(1) = (r(0) - r(1)) + (0.9 - 0.1)(h(0) - h(1)) => 0.2 (h(0) - h(1)) = 2 => 10.0000]; the convergent sum's limit is h(0) - pi . h = 5.0000, and |S_50 - 5| = 5.7e-05 = 0.8^51/0.2
(c) one-step mixing P = [[0.5, 0.5], [0.5, 0.5]], same r: pi = [0.5, 0.5], J = +0.0000, second eigenvalue 0.0; E_0 [sum_(t<T) (r(X_t) - J)] = T = 1: 1.0000, T = 10: 1.0000, T = 100: 1.0000, T = 1000: 1.0000 (the limit of expected finite-horizon sums exists and is 1: only the first term is off the mean)
(c) but the PATH's partial sum never converges: for t >= 1 each r(X_t) is +1 or -1 with probability 1/2, independently of the past, so S_T - 1 is a simple random walk — Var_0 S_T = T - 1 = 9, 99, 999 at T = 10, 100, 1000, and P_0(S_T = 1) = 0.2461, 0.0796, 0.0252 at T = 11, 101, 1001 -> 0 (an a.s. limit would need the increments to vanish; they are +-1 forever)
(c) Poisson solution with h(1) = 0: h = [2.0, 0.0]; h(0) - h(1) = 2.0000 = lim_T E_0[sum] - lim_T E_1[sum] = 1.0000 - (-1.0000) — the differential value is the limit of expected finite-horizon sums, not the expectation of a convergent series§51 prints the alternating chain's centred partial sums from state , their Cesàro average, the solution of its Poisson equation, and the time- law that never converges while the time average does; its block (c) is the one-step-mixing chain, whose expected finite-horizon sums sit at for every while the path's partial sum has variance .
"Evaluate the agent by running it" is three different estimation problems with three different theorems behind the average, and which one you are in decides whether the number is an estimate of anything:
- Episodic evaluation. The quantity is , the expected return of an episode. Run independent episodes from the start-state distribution and average the returns : the are i.i.d., the strong law of §5 gives a.s., and the CLT gives the error bar provided — a bounded horizon and bounded rewards give it, and the strong law needed only — with the episode as the unit, not the step. No irreducibility is needed, because no chain is being averaged along; the episodes are the independent draws. L1. What is not an estimate is one long run on the episodic chain: with an absorbing terminal state the chain is not irreducible, and the time average of one episode converges to the terminal state's reward — that warning stands.
- Average-reward, continuing evaluation. The quantity is along one unending trajectory, and the estimator is that time average. This is the ergodic theorem of §9.1, and it requires the induced chain to be irreducible and positive recurrent — the "ergodic MDP" assumption of average-reward RL, stated as such in Sutton & Barto — with the Markov-chain CLT and the ESS of §9.1 as the error bar. L1 for the condition; the condition is on the chain the policy induces, so a policy update can break it.
- Discounted occupancy. The of the discounted formulation is the normalised discounted occupancy , which is neither a stationary law nor the time average of one run; it is estimated from episodes, each state visit weighted by (or, in the continuing limit, by the stationary law of the bullet above, which is the average-reward formulation's ). The plain time average of a long run used in its place is an estimate of a different object, and the gap does not shrink with the run.
Our planning-under-uncertainty piece used rollouts throughout; the first bullet is the condition under which its averages mean what they say, and the error bar on them has the episode as its unit.
Checkpoint exercise 9. An MCMC chain has lag-one autocorrelation for the quantity you report and behaves like an AR(1). How many effective samples do draws give, and by what factor is the naive standard error too small? If you can afford to thin to every -th draw, does thinning increase the ESS? (ESS ; the naive error is times too small. Thinning never increases the ESS of a fixed-length run — it discards correlated-but-informative draws; it only saves storage. Run longer, or fix the proposal.)
10. Minimax, Bayes risk, and the price of a density
Not on the fast path. The practical destinations — the eval error bar (§7.6) and the SGD claim (§8.4) — do not depend on this section; it supplies the Bayes and minimax risks and the game that links them (§10.1), Le Cam's two-point lower bound and what a rate is (§10.2), the curse of dimensionality as a minimax rate (§10.3), and the two games that share the word minimax in a GAN (§10.4).
10.1 Three risks, and the game between the statistician and nature
A decision problem is a parameter , data , an action chosen by a rule , and a loss . The risk is — a function of , so rules are not totally ordered. Two ways to make them so:
- Bayes risk. Put a prior on and average: . The Bayes rule minimises it, and by Fubini it does so pointwise in : minimises the posterior expected loss. For squared error that is the posterior mean (a conditional expectation: §1.6 glossary), for absolute error the posterior median, for 0–1 loss on a discrete parameter space the posterior mode (on a continuous one the exact-match loss has risk one for every action; a small-ball loss recovers the MAP as a limit) — the first an instance of §4.2's projection with the posterior as the conditioning law, the other two its and 0–1 analogues, pointwise minimisers rather than orthogonal projections.
- Minimax risk. : the best guaranteed performance against the worst .
The two are linked by a game. For any prior, , so always — weak duality. When the minimax theorem holds (Wald 1950; the conditions are compactness and convexity, as in our game-theory piece's von Neumann theorem, with the statistician as the row player choosing and nature as the column player choosing a prior), equality holds and there is a least-favourable prior whose Bayes rule is minimax.
That gives Bertrand's "uninformative prior" of §0 one rigorous meaning (another is invariance, which is the answer Jaynes (1973) gave to Bertrand's own problem): an uninformative prior is a least-favourable one, and it is relative to the loss and the model, not a property of the parameter space. The uniform prior on the circle's chords was uninformative for none of the three constructions in particular; a least-favourable prior for a stated loss would have been.
One caveat: when is not compact the least-favourable prior may exist only as a limit — for the Gaussian mean of §10.2 on , is minimax because the Bayes risks under priors rise to as , and no proper prior attains it. L1.
10.2 Lower bounds: Le Cam's two points, and what a rate is
How does one prove that no estimator can do better than a rate? By reducing estimation to testing between two hypotheses the data cannot distinguish:
Le Cam's two-point method. If with , then for every estimator ,
Proof idea. Any estimator induces a test (guess the closer ); the test's worst-case error is at least (§2.4: the best classifier between two laws has accuracy ); and an error of the test is an estimation error of at least . Pinsker then converts TV to the KL between the -sample laws, which is times the one-sample KL.
§27 Gaussian mean, n = 100, sigma = 1: Le Cam separation delta = sigma/sqrt n = 0.100
Le Cam lower bound on minimax MSE >= (delta/2)^2 * (1 - sqrt(KL/2)) / 2 = 0.000625; sample-mean risk sigma^2/n = 0.01000Choosing makes the two hypotheses' -sample KL equal to — distinguishable but not reliably — and the bound comes out : the rate is right and the constant is loose by sixteen. That is what a minimax rate is: a statement about how risk scales, proved by exhibiting hypotheses the data cannot separate, with constants that neither side of the argument is trying to optimise. Fano's inequality (our earlier piece's §9.4) is the same argument with many hypotheses instead of two, and it is what the next subsection's rate rests on.
10.3 The price of a density: the curse of dimensionality as a theorem
Estimate a density (§1.6 glossary) on from samples, knowing only that has bounded derivatives. The minimax squared- risk is
(Stone (1980), Ann. Statist. 8, and Ibragimov & Khasminskii (1981) for density; Stone (1982) is the same rate for regression; Tsybakov (2009), Ch. 2, proves the lower bound for by Fano over a hypercube of bump perturbations, and the extension to is standard: hypotheses — the number grows exponentially in , and that is where enters the exponent). The numbers, with :
§27 nonparametric density estimation, smoothness s=2, squared-L2 minimax rate n^(-2s/(2s+d)):
d= 1 n=10^4: 6.31e-04 n=10^6: 1.58e-05 n=10^9: 6.31e-08
d= 2 n=10^4: 2.15e-03 n=10^6: 1.00e-04 n=10^9: 1.00e-06
d= 10 n=10^4: 7.20e-02 n=10^6: 1.93e-02 n=10^9: 2.68e-03
d= 100 n=10^4: 7.02e-01 n=10^6: 5.88e-01 n=10^9: 4.51e-01
d= 1000 n=10^4: 9.64e-01 n=10^6: 9.46e-01 n=10^9: 9.21e-01
n needed for rate 0.01 at s=2: d=1: 10^2.5, d=2: 10^3, d=10: 10^7, d=100: 10^52The table is with the constant set to — a scaling, not a risk, as §10.2 just said. At — a tiny image — a billion samples have brought the rate only to of its value, and bringing it to needs on the unit-constant power law — a scaling, since the constants hidden in depend on , and the class, and the rate is asymptotic at fixed . This is not a limitation of any method; it is the minimax rate, so every method is subject to it, including the one you have not invented yet. The curse of dimensionality is a theorem about estimating densities under smoothness alone. Three consequences, graded:
-
Generative models are not density estimators in this sense, and could not be (L1 for the rate, L3 for the mechanism). A model that produces good samples of images from examples is not achieving the smoothness rate at ; it is exploiting structure the minimax class does not assume. The candidate structures each have a rate: if the data lie on a -dimensional manifold, the rate becomes with the intrinsic in place of — for regression (Bickel & Li 2007; Kpotufe 2011), or for a density taken with respect to the manifold's volume measure, since a law on a -manifold has no Lebesgue density in at all — Pope et al. (2021) estimate between and for ImageNet, a number we grade L3, as it is an estimate from a particular estimator with its own assumptions; compositional and sparse structure give other rates. Which structure a trained model is actually exploiting is an open question, and "the manifold hypothesis" is the name of a hypothesis.
-
The evaluation inherits the curse or not depending on the divergence (L1). For a law with a density on a bounded subset of , , the empirical measure of samples converges to the truth in at rate (Dudley (1969) gives the upper and the lower bound) — so a Wasserstein distance between two sample sets in is dominated by sampling noise at any feasible — while maximum mean discrepancy with a bounded kernel converges at regardless of (an upper bound for the MMD rate; minimax for in that class). A reported Wasserstein distance between two sample sets has a dimension-dependent error bar; a kernel two-sample statistic does not.
The in is the dimension of the measure, not of the ambient space: Weed & Bach (2019) show the exponent is the law's intrinsic dimension — for a law that is regular on a -dimensional set (a density with respect to the -dimensional volume measure, or more generally Ahlfors regularity: every small ball of radius carries mass between and ) with , the rate is . The regularity is not decoration: without it the law's upper and lower Wasserstein dimensions need not coincide, and the rate sits between two exponents. Low dimensions and discrete laws behave differently: at the rate is ; at it is up to a logarithm (Ajtai, Komlós & Tusnády (1984) for the uniform law on the unit square); and a law on finitely many points converges at whatever the ambient — so the in is the dimension of the measure at the scales samples resolve, and a quoted rate needs the regularity stated with it.
That is a statement about estimation, not about testing power: for a fixed kernel the population MMD between two alternatives can itself shrink with (Ramdas, Reddi, Póczos, Singh & Wasserman (2015), AAAI 2015), so the bandwidth, the effect size and the class of alternatives govern what a kernel test can detect; the bound is about the error bar, not the resolving power. (FID is the squared between two fitted Gaussians, so its error is the covariance-estimation error of §7.4 in the feature dimension, not the empirical-measure rate.) That is a reason to prefer the second class for measurement, independent of which better matches perception.
-
"Estimate the density, then act" is the wrong order in high dimension (L1 for the rate, L2 for the slogan). Bayes-optimal action needs only the conditional or a functional of it (§4) — but estimating that conditional under smoothness in alone still pays with the dimension of , the regression rate of Stone (1982) cited above; the curse sits in the conditioning variable, not the response. What discriminative learning saves is the modelling of , not the exponent, and the escape is again structure in . Learning a score rather than (§9.4) is the same kind of saving: it sidesteps the normalising constant, not the rate.
10.4 Two minimax problems that share a word
Our game-theory piece treated the GAN as a minimax game . In this section's vocabulary that is a different game from the statistician-versus-nature one, and the difference matters:
- In statistical minimax, the adversary is nature choosing , the object minimised is a risk, and the value is a property of the problem.
- In the GAN objective, the adversary is a function , and the inner supremum is a variational representation of a divergence: with the optimal discriminator, (Goodfellow et al. (2014)), and Nowozin, Cseke & Tomioka (2016) generalise to any -divergence via its convex conjugate — the Fenchel-conjugate representation of Nguyen, Wainwright & Jordan (2010), a sibling of the Donsker–Varadhan form our Information Domain piece's §3.1 used for mutual-information bounds (for KL the two differ, and the conjugate bound is the weaker one). The "adversary" is a dual variable; the game is a way of computing a divergence, not a decision problem against nature.
So the GAN's minimax is L2 as a correspondence to the game of §10.1 — same optimisation structure, every term defined, different meaning of the players — and L1 as a statement that its inner value is a divergence, which is what §2.4 then says is infinite or saturated when the supports are disjoint.
A saturated discriminator has a consequence for the generator's gradient, and the consequence has two parts with two grades. The first is about the divergence and is L1: under the JS objective a at its cap means the divergence is at its cap, so the generator's gradient vanishes (or, with the non-saturating loss, keeps a direction but explodes in variance); the Kantorovich–Rubinstein duality that the WGAN critic of §2.4 estimates is a theorem, and is finite and continuous under the displacement of a support where JS saturates — for and , for every , flat in , while :
§44 Where JS saturates and W1 does not, and where even a finite W1 has zero generator gradient
(a) P = delta_0, Q_theta = delta_theta: JS in nats (ln 2 = 0.6931), W1 = |theta|, dW1/dtheta = sign(theta)
(a) theta = 0.1 : JS = 0.6931 (= ln 2, flat in theta: zero gradient) W1 = 0.1000 (quantile formula 0.1000) dW1/dtheta = +1.0
(a) theta = 0.5 : JS = 0.6931 (= ln 2, flat in theta: zero gradient) W1 = 0.5000 (quantile formula 0.5000) dW1/dtheta = +1.0
(a) theta = 1.0 : JS = 0.6931 (= ln 2, flat in theta: zero gradient) W1 = 1.0000 (quantile formula 1.0000) dW1/dtheta = +1.0
(a) theta = 2.0 : JS = 0.6931 (= ln 2, flat in theta: zero gradient) W1 = 2.0000 (quantile formula 2.0000) dW1/dtheta = +1.0
(a) theta = 5.0 : JS = 0.6931 (= ln 2, flat in theta: zero gradient) W1 = 5.0000 (quantile formula 5.0000) dW1/dtheta = +1.0
(b) P = delta_1, Q_theta = delta_(theta^2): W1 = |1 - theta^2|, dW1/dtheta = -2 theta sign(1 - theta^2)
(b) theta = 0.0 : W1 = 1.0000 (quantile formula 1.0000) dW1/dtheta = +0.0000 <- distance 1, gradient exactly 0: the generator is stuck at a stationary point
(b) theta = 0.5 : W1 = 0.7500 (quantile formula 0.7500) dW1/dtheta = -1.0000
(b) theta = 0.9 : W1 = 0.1900 (quantile formula 0.1900) dW1/dtheta = -1.8000
(b) theta = 1.1 : W1 = 0.2100 (quantile formula 0.2100) dW1/dtheta = +2.2000The second is about the generator's parameter and is L3: that is nonzero, stable and useful is a property of the parametrisation and of the critic actually trained, not of the divergence. and have , equal to at with derivative exactly there (§44(b)): a finite, informative distance and a generator that cannot move from a stationary point. The optimal critic need not be unique, nor differentiable where the gradient is taken, and a critic from a finite-dimensional class — weight clipping, a gradient penalty — adds to the dual an approximation that the duality theorem does not cover. That the gradient this gives leads anywhere good is the L3 part, as §2.4 graded WGAN's advantage.
Action changed: persistent near-perfect discrimination on a sufficiently large independent evaluation sample is evidence of substantial mismatch — not proof that the supports are disjoint: a flexible discriminator memorises a finite training sample to even when and the Bayes accuracy is . Investigate support separation, discriminator overfitting and feature differences before diagnosing divergence saturation. If the supports are the cause, change the measures, not the model's size: add instance noise to both laws, train against a critic, or fix the generator's support (§2.4's support diagnostic carries the grades).
The two games meet in one place: the discriminator's Bayes accuracy is , so a classifier-based two-sample test is an estimate of total variation — on an independent sample, and from below, since no classifier's accuracy exceeds the Bayes accuracy — and Le Cam's method of §10.2 is that test used as a lower bound.
The on-ramp to the forthcoming piece: §10.1's Bayes rules are what a Bayesian computes, and the non-parametric Bayes methods — Gaussian processes, Dirichlet processes — are priors on function and measure spaces whose posterior contraction rates are the Bayesian analogue of this section's minimax rates, with the same appearing as the price of smoothness alone.
Checkpoint exercise 10. At with , what is the minimax rate at , and how many samples would a intrinsic dimension need for the same risk? (Rate . At the rate is , so gives : a thousand samples instead of a million, on the unit-constant power law — a scaling, not a sample count, since the constants in depend on , and the class and the rate is asymptotic at fixed . The manifold hypothesis, if true for your data, is worth three orders of magnitude here.)
11. Conditional independence, graphs, and exchangeability
Not on the fast path. The practical destinations — the eval error bar (§7.6) and the SGD claim (§8.4) — do not depend on this section; it supplies conditional independence as the assertion every graphical model and context window makes (§11.1), de Finetti's theorem and split conformal prediction from exchangeability (§11.2), and the order test of in-context learning read as Bayesian inference (§11.3).
11.1 Conditional independence is a statement about three σ-algebras
and are conditionally independent given , written , if a.s. for all , (σ-algebras: §1.6 glossary) — equivalently, when densities exist, , equivalently : once you know , tells you nothing more about . Every structural assumption in a probabilistic model is a list of such statements, and the two factorisation theorems say what lists are consistent with what structures.
The chain rule is always true. holds for every joint law, in every ordering, with no assumption — it is the tower property. An autoregressive language model is this identity with a network for each factor: it assumes no conditional independence at all, which is why it is universal, and why it needs the whole context. The one assumption it does make is the context window: truncating to the last tokens asserts , a Markov property of order , and the model's error on long-range dependence is the cost of that assertion. L1.
Directed factorisation. A Bayesian network on a DAG asserts , equivalently the local Markov property (each variable is independent of its non-descendants given its parents). Pearl's d-separation (Probabilistic Reasoning in Intelligent Systems, 1988) reads every implied conditional independence off the graph, and it is sound and complete: holds in every law factorising over if and only if d-separates from (Verma & Pearl 1988; Geiger, Verma & Pearl 1990).
A state-space model or RNN is a Bayesian network with the hidden Markov chain's structure, and its defining assumption is : our post-transformer piece asked how much a fixed-size state can carry, and this is the sentence that makes the question well posed — the state is a conditional-independence assertion, and attention asserts none. Stated that way the capacity question has a unit: it asks how much of the mutual information between past and future, , a fixed-size state must carry — the quantity our Information Domain piece works in — and nothing here says how much a given architecture does carry. A convolution's receptive field is the same kind of assertion at each layer. L2 as a reading of architectures, L1 as a statement about the graphs.
Undirected factorisation. For a Markov random field on an undirected graph, the Hammersley–Clifford theorem (1971, unpublished; Grimmett (1973) gives the proof by Möbius inversion and Besag (1974) another) says that for a strictly positive density, the pairwise, local and global Markov properties coincide and are equivalent to a Gibbs factorisation over the cliques of the graph — with the energy a sum of clique terms. The positivity condition is not decoration: with zero-probability configurations the equivalence fails. Boltzmann machines, Ising models and the energy-based world models of our W13 piece are this theorem's objects, and the Langevin sampler of §9.3 is how one samples them. The Markov blanket of a node — its neighbours in the undirected case; parents, children and co-parents in the directed case — is a conditioning set that screens it from everything else (the smallest one only under faithfulness), and it is what a Gibbs sampler conditions on at each step.
11.2 Exchangeability, and the theorem that says where the prior comes from
A sequence is exchangeable if its law is invariant under every finite permutation of indices: . I.i.d. sequences are exchangeable; the converse fails:
§28 Pólya urn (start 1 red, 1 blue; draw, replace, add one of the drawn colour)
P(first ball red) = 0.5; P(second red | first red) = 2/3; P(second red) = 0.5000 = P(first red): exchangeable, not independent
limiting red fraction over 20,000 urns, 5 bins: [0.2011 0.2047 0.1957 0.1981 0.2004] (Beta(1,1) = uniform -> 0.2 each)
(SE of the line above: each bin frequency ± 0.0028, binomial sqrt(0.2 · 0.8 / 20,000); the farthest entry is 1.7 SE from 0.2)The urn's draws are exchangeable (any sequence with reds in draws has the same probability, whatever the order) and strongly dependent (a red draw makes the next red more likely). Each bin fraction over urns has standard error , and the largest deviation from among the five bins, , is of them. The second line is the theorem:
de Finetti (1931; Hewitt & Savage 1955 for general spaces). An infinite sequence is exchangeable if and only if it is a mixture of i.i.d. sequences: there is a random probability measure such that, conditionally on , the are i.i.d. with law . For binary sequences, for a unique prior on , and is the law of the limiting frequency , which exists a.s.
For the Pólya urn the limiting fraction is uniform on — Beta, matching the five bins — and conditionally on that fraction the draws are i.i.d. coin flips. The consequence is the foundation of Bayesian inference, and it is a consequence, not an axiom: if you judge a sequence exchangeable — if you would not change your probabilities on learning the order of the data — then a prior over a latent parameter and i.i.d. sampling given it are forced to exist, and the prior is the law of the limiting frequency. You do not add a prior to a model; exchangeability implies one, and what is chosen is its form.
The uniqueness is a statement about the whole infinite exchangeable law: observations determine neither nor the form you choose for it — that remains a modelling decision, and §11.3's grade reflects it. The forthcoming piece on Bayesian and non-parametric inference starts here. Two restrictions: the theorem needs an infinite exchangeable sequence (finite exchangeable sequences are mixtures only approximately — Diaconis & Freedman (1980) bound the error by for coordinates out of on a -point state space, in general), and it needs exchangeability, which a time series does not have.
The Hewitt–Savage 0–1 law is the companion: any event invariant under finite permutations of an i.i.d. sequence has probability or , which is Kolmogorov's 0–1 law (§1.5) with permutations in place of the tail.
Exchangeability has a second consequence with the opposite flavour — no prior at all. Split conformal prediction: fit any model on one half of the data, compute the residuals on the other half of size , and take as the prediction set for every whose residual is at most the -th smallest calibration residual. If the pairs are exchangeable, then the marginal coverage holds in finite samples, for any model and with no distributional assumption — the probability is over the calibration pairs and the new pair together, which is what "marginal" means here (Vovk, Gammerman & Shafer (2005), Algorithmic Learning in a Random World; Lei, G'Sell, Rinaldo, Tibshirani & Wasserman (2018)) — L1.
The proof is one line, with one condition inside it: the residuals are exchangeable, so the rank of the new one among them is uniform on — when there are no ties. With ties (a discrete score, or two residuals that coincide) the rank is not uniform; the lower bound still holds, but conservatively, with no matching upper bound, and breaking ties at random restores the uniform rank and with it the two-sided statement . The index can also run past the sample: when — at and it is — there is no such residual, the convention is a threshold of , and the set is every : trivial, and the coverage guarantee still holds.
Two things the theorem does not say. It does not say the coverage is at your : conditional coverage, for every , is not guaranteed in general — at a non-atom of the law of no distribution-free method achieves it with sets of finite expected width (Vovk (2012); Foygel Barber, Candès, Ramdas & Tibshirani (2021), arXiv:1903.04684) — and what split conformal delivers is the average over . And it is exchangeability, not independence, that is used, and distribution shift between calibration and deployment breaks exactly this hypothesis — which is why the coverage promise does not survive it.
Split conformal is one of three ways to a distribution over predictions, each with its own assumptions, and the three answer different questions. Split conformal returns a set, with marginal coverage under exchangeability, no model of and no posterior (L1, above). A deep ensemble is a plug-in to §4.2's law-of-total-variance split, the spread of its members standing in for the posterior law of , and returns an uncertainty number with no coverage guarantee (L3, §4.2). An approximate Bayesian predictive — a variational BNN's , say — has coverage only under the model, and only as far as the approximation reaches the posterior (L2/L3). Only the first is distribution-free. They compose rather than compete: take an ensemble's predictive spread into the conformal score — the residual divided by the ensemble's standard deviation — and its intervals inherit split conformal's marginal coverage, because the theorem holds for any score computed from a model fitted on the other half (L1).
11.3 In-context learning, read through de Finetti, with its grade
Xie, Raghunathan, Liang & Ma (2022) propose that in-context learning is implicit Bayesian inference: if the pretraining distribution is a mixture over latent "concepts" and the examples in a prompt are i.i.d. given the concept — de Finetti's structure exactly — then the optimal next-token predictor on a prompt of examples is the posterior predictive , and the model's in-context behaviour is what that predictor does. The theorem under the proposal is de Finetti, and it is L1; the claim that a trained transformer computes that posterior is L3, an empirical hypothesis with evidence for and against.
The evidence against is itself a probability statement: the posterior predictive of an exchangeable model is invariant to the order of the examples, and in-context learning is measurably not — Lu et al. (2022) show accuracy swinging from near-chance to near-state-of-the-art under permutations of the same examples. A model whose output depends on the order is not computing the exchangeable posterior, whatever else it is doing. The mechanism is not the causal mask — Bayes' rule is sequential and order-invariant at once, so nothing in a causal architecture forbids an order-invariant posterior predictive; it is that the trained function, positional encodings included, does not implement the permutation-invariant map Bayes' rule would. That is the kind of test this section's vocabulary makes possible: exchangeability is a property you can measure a model for.
Checkpoint exercise 11. A Pólya urn starts with red and blue. What is , what is , and what is the law of the limiting fraction? Then: a prompt of four labelled examples is given to an exchangeable predictor in two different orders. By how much may the two predictions differ? (Given first red the urn holds red, blue: . Unconditionally, , equal to , as exchangeability requires. The limiting fraction is Beta. The two predictions must coincide exactly — any difference is a measurement of non-exchangeability.)
12. Where intuition breaks, and what to do instead
Fast path · stop 13 of 14. Next stop: §13. This section's numbers run in
02_fast_path.ipynb.
The graded bridges to learning theory and uncertainty quantification are indexed in §13's bridge map; this section is about the intuitions that break.
A catalogue, in the order the failures arrive in practice. Each entry names the object that was left unstated, the section that states it, and the action.
- A mean that does not exist (§5.2, §6.4). The sample mean of a Cauchy, of St Petersburg payouts, of any quantity with , looks like a noisy estimate at every and is not an estimate of anything. Symptom: the running mean jumps on single samples late in the run; the block-mean kurtosis grows with the block size. Action: report quantiles or a trimmed mean, fit a tail index before trusting a mean, and never put a Gaussian error bar on a quantity whose variance you have not checked is finite.
- Almost surely is not surely (§1.5). A continuous random variable (§1.6 glossary) takes a value of probability zero, every time. Null sets can be dense. "This cannot happen" and "this has probability zero" are different claims, and "the model gave the observation probability zero" is three different claims. Observing under a model with a density is no evidence against the model: every singleton is null under a continuous law, and was true before the draw and is true of every other value. Observing a value outside the model's support — zero mass on a measurable neighbourhood of the observation — is a refutation, not by a theorem but by the observation, which is worse: the likelihood is zero, the log-likelihood , and a posterior gives that model mass zero whatever the prior. And comparing two models on one observation is a comparison of their densities with respect to one base measure (§2.2), in which the number zero never appears. Action: before calling a model refuted by an observation, say which of the three you mean.
- Conditioning on a null event is not defined until you say how (§0, §4.4). Two sequences of approximating events can give two answers. What fixes one is not a density for the joint law — has a joint law singular to Lebesgue measure and the unambiguous kernel at every — but regularity of the conditional kernel: a version continuous in (in the weak or the total-variation sense) is the one every shrinking family selects, and a joint density supplies it only together with a continuity or domination condition on the kernel; singularity alone decides nothing. Action: when conditioning on an exact continuous observation, write down the observation model — the kernel you intend, as a noise level or a named family of shrinking events — and when the model is a learned pushforward (§1.6 glossary) whose kernel at the observed coordinates you have not verified to be regular, say so, because then the family of events is what defines the answer.
- A density is not a probability (§2.2). It can exceed one, it depends on the base measure, and log-likelihoods are comparable only under the same one. Action: dequantise discrete data before comparing continuous models; never compare a continuous model's log-density with a discrete model's log-mass.
- The running mean leaves every band of fixed width in standard errors (§5.4, §8.2). The law of the iterated logarithm guarantees excursions arbitrarily close to standard errors wide, infinitely often ( a.s.: beyond infinitely often, beyond finitely often). That is a statement about a running mean of fresh draws from one law — a metric accumulated over a stream of fresh samples at fixed parameters. A validation curve re-evaluated on one fixed held-out set is not one: its noise is a single shared draw, the same at every checkpoint, and the error bar on a difference of checkpoints is the paired one (Appendix C.2). Action: a stopping rule on a monitored curve is an optional-stopping problem (stopping time: §1.6 glossary); use a separate held-out set for the final number, or a test martingale for the monitoring.
- Peeking is a different test (§8.2). A hundred looks at a test gave false positives. Action: Ville's inequality — a non-negative martingale starting at one crosses with probability at most under every stopping rule.
- "Converges" has four meanings (§5.1, §8.4). A per-step bound in expectation, almost-sure convergence of the iterate, convergence to a neighbourhood, convergence in distribution of the noise. Action: name the mode (§1.6 glossary), and name the noise — the §8.4 card and its regime table carry the hypotheses, and in one line: a constant step with the exact gradient converges; under persistent additive noise it converges in law, not almost surely, to a stationary law whose floor on the unit quadratic is (Gaussian only when the noise is); under multiplicative noise it converges almost surely when and in mean square only when — the example of §8.4 has a.s. while (§40); with noise that vanishes at the optimum it converges almost surely only when the contraction condition also holds — vanishing noise alone is not enough (: , almost-sure divergence, §40(b)), and almost-sure convergence does not imply convergence of the expected loss. The typewriter sequence converges in probability and in every , and no single run of it settles.
- Ergodic is not mixed (§9.2). Every irreducible Metropolis chain on a multimodal target is ergodic; the useful ones have a spectral gap (the hypotheses under which the time average has a CLT are the §9.1 card's). Action: compute the integrated autocorrelation time and the effective sample size; a standard error that assumes independence is wrong by , which was on E4.
- Independence is not uncorrelatedness, and pairwise is not mutual. and for symmetric are uncorrelated and dependent; three fair bits where the third is the XOR of the first two are pairwise independent and not independent. Independence is a statement about σ-algebras, not about second moments.
- Simpson's reversal is a conditioning statement, not a paradox (§4.1). The contrast and the contrast can have opposite signs for every value ; which σ-algebra you condition on is a modelling decision about the mechanism, and the data cannot make it for you. One level up, and are different objects: the second is a conditional in a different measure, the one the intervention induces, and no amount of conditioning in the observational measure computes it without assumptions about the mechanism (Pearl 2009) — L1 for the distinction; which assumptions suffice is the subject of causal inference, not of this piece.
- High dimension has no intuition from three (§7.2). A Gaussian's mass is in a shell, not near its mode; random directions are orthogonal; nearest and farthest neighbours are at the same distance; a covariance needs . Action: compute the concentration numbers for your before reasoning by picture.
- The two-envelope problem. One envelope holds twice the other; you open one, see , and reason that switching yields , for every . The error is an improper prior — there is no probability measure on the amounts under which the conditional reasoning holds for every — and the expectation being manipulated does not exist. With a proper prior the same symptom appears only when the amounts have infinite mean (Broome 1995), and then the resolution is item 1. Every argument that "works for every " with a prior it never stated is this one.
13. What to actually take away
Fast path · stop 14 of 14. This is the last stop; the assumption map below is what to take away. This section's numbers run in
02_fast_path.ipynb.
The assumption map. Each conclusion a training run or an evaluation leans on has one assumption that does the work; the table names it, and the section that proves the conclusion from it. The fast path ends on this table.
| Desired conclusion | Crucial assumption | Where it is proved here |
|---|---|---|
| The sample mean converges almost surely to the mean | integrability, , with independence or a dependence condition (ergodicity) in its place | §5.2 |
| The sample-mean error bar is Gaussian | i.i.d.: a finite nonzero variance (the classical CLT). Dependent: a CLT established for the process — ergodicity or mixing plus a moment condition — with a finite long-run variance; the long-run variance alone is not enough (§50) | §6.2, §9.1, §50 |
| The expectation follows the convergence | uniform integrability together with convergence in probability | §3.2 |
| The pathwise gradient is unbiased | differentiation under the expectation: one integrable dominator for the difference quotients | §3.3 |
| Test accuracy estimates population accuracy | independent held-out examples, and no adaptive reuse of the set | §7.6 |
| The MCMC mean has a CLT | ergodicity, with a moment condition and a mixing condition | §9.1 |
| Constant-step SGD converges in mean square | a contraction on average and a noise-moment condition ( on the scalar model) | §8.4 |
| Conformal sets have marginal coverage | exchangeability of the calibration and test pairs | §11.2 |
The bridge map. Where each bridge from the objects of this piece to a claim practitioners write actually lives, and how much of it is a theorem:
| Bridge | Where | What is a theorem (L1) | What is not (L2–L3) |
|---|---|---|---|
| Rademacher complexity | §7.5 | the concentration step: the supremum of the empirical–population gap sits within of its mean (McDiarmid) | the complexity measure that bounds the mean for a deep network — L2–L3, because the measure that is small on the trained network is not known |
| VC dimension | §7.5 | Sauer–Shelah with Massart's lemma: the Rademacher mean is ; the dimension of a piecewise-linear network | that a class-based bound explains why a deep network generalises — L3 at best, vacuous on real training runs |
| Algorithmic stability | §7.5 | the gap in expectation is at most under uniform stability; SGD's on a convex smooth loss; the high-probability bound with its term | the non-convex SGD constant, which grows with — L2 |
| PAC-Bayes | §7.5 | the inequality, for a loss in and a prior fixed before the data, simultaneously for every posterior | the prior and posterior that make it tight for a trained network — L3; cross-entropy is outside the displayed form until truncated or given a tail condition |
| Sub-Gaussian / sub-exponential tails | §7.1 | the chain Markov → Chebyshev → Chernoff → Hoeffding → Bernstein, each under its stated hypothesis (§7.5 grades the inequalities L1) | no L2–L3 claim is made there; what has to be checked is which tail class the statistic is in, and §7.4's bounded three-point law shows the price of guessing — (§47) |
| Matrix concentration (matrix Bernstein) | §7.4 | Vershynin's Thm 4.7.1 with its under , the §14 Gaussian table and the §47 arithmetic — L1; matrix Bernstein (Tropp 2012) stated with its matrix variance, its and its , and the spectral-norm error bar it gives a covariance or Gram matrix — L1 | "my draws are independent with bounded norm" — L3 until checked; and dropping for a non-Gaussian law, where the statement is false, not approximate (§47) |
| Proper scoring rules, calibration–sharpness | §4.2, §4.3 | the population minimiser of a strictly proper score is the conditional law and the excess score is an expected divergence; the calibration–refinement split; recalibration cannot buy sharpness (§49) — L1 | "the model is calibrated" for a trained — L3, to be checked, not inherited from the optimum |
| Split conformal | §11.2 | marginal coverage in finite samples under exchangeability, for any model — L1 | conditional coverage at your — not guaranteed, and unattainable distribution-free with finite-width sets at a non-atom; a shift between calibration and test breaks the exchangeability |
| Deep ensembles / approximate Bayesian predictives | §11.2, §4.2 | the law-of-total-variance identity, for whatever law the members have — L1; an ensemble spread fed into a conformal score inherits marginal coverage — L1 | an ensemble's spread as a posterior — L3, no coverage guarantee; a variational BNN's predictive — L2/L3, coverage only under the model and as far as the approximation reaches |
| NNGP prior / NTK | §6.6 | at initialisation the output is a GP with the kernel the architecture determines — L1; under gradient flow at infinite width and squared loss the trained function is again Gaussian (NTK) — L1 in the limit, for that loss | "a trained wide network is a GP" — L2, squared loss only; finite width — L3; feature-learning parametrisations leave the regime |
| Girsanov and the diffusion objective | §9.4 | Anderson's reversal; the path-space KL as the likelihood-weighted score-matching error plus , bounding the expected negative log-likelihood; the singularity of an atomic target — L1 | why it trains well and why a schedule is good — L3; "the learned score is close enough" — L3 until the held-out loss is measured; the running sampler's three error terms are not graded by the theorem |
| Markov-chain CLT and ESS | §9.1 | the CLT under geometric ergodicity and , , and the AR(1) numbers (§23, §36) — L1 | an ESS estimated from a run shorter than the mixing time, or from a heavy-tailed or non-ergodic stream (§45, §50) — a number with no theorem behind it |
| Minimax rate and the curse | §10.3 | the rate , which no method escapes under smoothness alone; at and a bounded-kernel MMD at — L1 | which structure a generative model exploits — L3; "estimate the density, then act" — L2 for the slogan |
| Importance-sampling ESS | §3.4 | the variance formulas for plain and self-normalised importance sampling (the latter asymptotic) and the limit — L1 | the weight-based ESS as a confidence-interval denominator — not valid: it understates the bar by and at a shift of (§48) |
In descending order of how often it will be useful. Each is one principle and one restriction; the numbers and the caveats live in the sections, and the section is where to send anyone who quotes the principle without the restriction.
- The MSE-optimal predictor is the conditional mean, and a model's excess MSE is its squared distance to it (§4.2). Restriction: that is the population minimiser over all measurable functions; a trained model's gap has an approximation and an estimation part, and calibration is a property the optimum has, not one the model inherits.
- Compute the eval error bar before comparing models, and pair when you can (§7.6). Restriction: Hoeffding is loose by against the binomial at accuracy and by against Bernstein at a rate; the Gaussian interval on a rare event is wrong in shape, not just width, until (§6.3); and selecting the best of checkpoints on the same set biases the winner by up to — Hoeffding's guarantee, at , — with ( there) the Gaussian approximation, not a bound (§7.6, §42).
- A monitored curve is an optional-stopping problem (§5.4, §8.2). Restriction: the LIL envelope — standard errors, at — bounds a running mean of a stream; a curve re-scored on one fixed held-out set has a fixed- band instead, and a difference of two checkpoints on it has the paired error bar of Appendix C.2, from the per-example differences, which times the single-checkpoint bar does not bound — the bar it does live in is the paired one of §7.6's Action box, and Appendix C.1 sizes it; the hundred-look test and its two fixes are §12's items 5 and 6.
- Name the mode in which your convergence claim is true (§5.1, §8.4). Restriction: Robbins–Monro steps give almost-sure convergence with no rate; the schedule gives a rate in expectation with no almost-sure guarantee from the theorem; a constant step converges in the mode its noise decides, and under noise that vanishes at the optimum it converges almost surely only when the contraction condition holds — vanishing noise alone is not enough (: almost-sure divergence), and almost-sure convergence does not imply convergence of the expected loss; §12 item 7 gives the four regimes with their numbers. On E2 the schedule that satisfies the theorem was the slowest.
- A gradient may pass inside an expectation only with a dominating function (§3.3). Restriction: the pathwise estimator is unbiased for Lipschitz losses and returns exactly zero for the 0–1 loss; the score-function estimator's convenient sufficient condition is a support that does not move with — when the support moves, the estimator is incomplete rather than wrong, and Leibniz's boundary term restores it (§3.3, §33); a surrogate loss is a different objective, with a gradient unbiased for that objective, while straight-through keeps the original objective and substitutes a derivative that is biased for its gradient.
- KL is infinite across supports, and that is a theorem about absolute continuity (§1.6 glossary), not a numerical issue (§2.4). Restriction: total variation stays finite always, Wasserstein when both laws have a first moment; Pinsker converts a KL into a bound on every event; which divergence your objective controls decides which failure you can see. The GAN's inner supremum is a divergence (§10.4), and WGAN's advantage is a hypothesis about an optimiser — L3, with §10.4's example as a finite distance whose generator gradient is zero.
- Correlated draws are worth independent ones (§9.1). Restriction: that is the Markov-chain CLT under geometric ergodicity and a moment condition — one sufficient set of hypotheses, not a necessary one (§9.1's card); ergodicity alone has no rate, the spectral gap on a multimodal target is , the highest-acceptance proposal was the worst by , and the unadjusted Langevin step biases the variance by (§9.3).
- In , random directions have cosine , norms sit at , and a covariance needs with error (§7.2, §7.4). Restriction: these are statements about Gaussian vectors, and for a sub-Gaussian law the covariance error carries §7.4's factor , which rare large values can make arbitrarily large; the extent to which data are not like that is the manifold hypothesis, and its intrinsic dimension is an estimate.
- The curse of dimensionality is a minimax rate, , and no method escapes it under smoothness alone (§10.3). Restriction: structure changes the exponent — intrinsic dimension replaces — and the evaluation inherits the curse under ( for a law with a density on a bounded set, ; a regular law on a -dimensional set with has in place of , and or a discrete law gives up to logarithms) but not under a bounded-kernel MMD (). Which structure a trained generative model exploits is open.
- An infinite-width network at initialisation is a Gaussian process by the central limit theorem, a diffusion model is an exact time reversal with a learned score, and an autoregressive model asserts no conditional independence at all (§6.6, §9.4, §11.1). Restriction: the first is L1 for the prior and L2 for training; the second is L1 for the reversal and for the path-space KL objective — a bound on the marginal KL and so on the expected negative log-likelihood, the per-sample bound being a separate theorem — and L3 for why a schedule is good; the third's one assumption is the context window, and a model whose in-context predictions depend on example order is measurably not the exchangeable posterior de Finetti would give it (§11.3).
Our Fourier piece said: choose the basis where your problem is easy. Our Information Domain piece said: know what you are paying for, in what units, and whether the exchange rate is a theorem. This one says: name the measure, name the σ-algebra, and name the mode — and then most of what you believed about your training run is either a theorem or a hypothesis, and you will know which.
Appendix A. Probability before measure: the history, as argument
This appendix is optional; nothing in the main text depends on it. The modern definition is ninety years old and the subject is four hundred. The history is worth reading as an argument for the definition, because every piece of the 1933 axioms was forced by a specific failure of the intuition that preceded it.
Games (1564–1713). Cardano's Liber de ludo aleae (written around 1564, printed 1663) counts favourable cases over equally likely ones — a measure on a finite set, with the "equally likely" doing all the work and never defined. Pascal and Fermat's 1654 correspondence on the problem of points, and Huygens's 1657 treatise, add expectation. Jacob Bernoulli's Ars Conjectandi (1713) proves the first limit theorem, the weak law of large numbers, and introduces the idea that probability is what frequencies converge to — the empirical content that §5.2 formalises and that the strong law would not fully justify for two centuries.
The normal law (1733–1812). De Moivre (1733) finds the Gaussian as the limit of the binomial — the first central limit theorem, for the fair coin, by direct asymptotics of factorials. Laplace's Théorie analytique (1812) generalises it with the characteristic function as the tool, which is §6 in its original form: Laplace used the Fourier transform of a law to add independent variables contemporaneously with Fourier's own work on heat (1807–1822). Bayes (1763) and Laplace (1774) had meanwhile inverted the question — the probability of a cause given its effects — which is the prior of §10.1 and §11.2 in its first form, a century and a half before de Finetti said where it comes from.
Chebyshev's school and the CLT (1867–1922). Chebyshev's inequality (1867) is the first concentration bound and proves the weak law in a line (§7.1). Markov's chains (1906) were introduced in a dispute about whether the law of large numbers needed independence — it does not, and §9.1 is his answer — and Lyapunov (1901) and Lindeberg (1922) proved the central limit theorem for non-identical summands by the characteristic-function method, which is the proof §6.2 gives.
Measure (1902–1933). Borel (1909) proves that almost every number in is normal — the strong law for E1, and the first theorem that needed Lebesgue's 1902 integral to state, because "almost every" is a measure statement. Fréchet, Steinhaus (1923, who modelled coin tossing on Lebesgue measure on explicitly) and Wiener (1923, Brownian motion as a measure on path space) build probability on measure theory piece by piece. Kolmogorov's Grundbegriffe (1933) collects it into §1.1's three axioms, adds the extension theorem (§1.4) and the σ-algebra definition of conditional expectation (§4.1), and makes the subject one. Lévy's continuity theorem (1925; §6.1) and his 1937 book bracket the Grundbegriffe.
Martingales and chains (1939–1953). Ville (1939) introduces martingales to formalise the impossibility of a gambling system, proving the inequality of §8.2; Doob's 1953 Stochastic Processes builds the theory of §8 and makes "stopping time" and "optional stopping" precise. Feller's two volumes (1950, 1966) fix the pedagogy for the next half-century, and Robbins and Monro's 1951 paper, written in that vocabulary, is the first convergence proof for what is now stochastic gradient descent.
High dimension (1970–2018). Fernique, Sudakov and Tsirelson–Ibragimov–Sudakov (1976) prove Gaussian concentration (§7.1); Talagrand's 1995 inequalities and Ledoux's 2001 monograph make concentration of measure a subject; the Bai–Yin law (1988) and the random-matrix work behind §7.4 arrive from physics and statistics at once. Vershynin's High-Dimensional Probability (2018) is the textbook that turns it into a toolkit, and §7 is a guided raid on its first five chapters. The argument of the history is this: every time probability was extended to a new kind of question — infinite sequences, continuous time, dependence, high dimension — the extension was a new measure on a new space and a new σ-algebra of questions, and the 1933 definition absorbed it without change.
Appendix B. Where the machinery is load-bearing outside machine learning, and the test
This appendix is optional; nothing in the main text depends on it. A connection earns a level by producing a number that constrains you. The four fields below each use one theorem of this piece as a load-bearing member, and in each the number is the thing the field is built on.
- Statistical mechanics. Boltzmann's ergodic hypothesis (1870s) is §9.1's Birkhoff theorem asserted for Hamiltonian flow: time averages along one trajectory equal microcanonical averages. The Gibbs distribution is §11.1's Hammersley–Clifford factorisation for a lattice of local interactions, and the partition function is the normalising constant §9.2's Metropolis algorithm was invented (1953) to avoid computing. The concentration of §7 is the thermodynamic limit: a macroscopic observable is a sum of terms with a standard deviation of order relative to its mean.
- Finance. Harrison and Kreps (1979) and Harrison and Pliska (1981) prove, for finite discrete-time models, that a market admits no arbitrage if and only if discounted prices are martingales under some equivalent measure (in continuous time the condition is "no free lunch with vanishing risk", Delbaen & Schachermayer 1994) — §8's martingale and §2.2's absolute continuity ("equivalent" means mutually absolutely continuous), with Girsanov's theorem (§9.4) as the change of measure. The Black–Scholes price is an expectation under that measure; the whole of derivative pricing is optional stopping and Radon–Nikodym.
- Genetics. The Galton–Watson branching process (1874) asked whether family names die out; the answer — extinction is certain if and only if the mean offspring count is at most one, the degenerate case of exactly one child always excluded — is §8's martingale convergence theorem applied to the normalised population. The Wright–Fisher model of allele frequencies is a Markov chain (§9) whose diffusion limit is a diffusion with state-dependent noise, in the neutral case, not of Langevin form, and Kingman's coalescent is its time reversal (§9.4's idea, in genealogies).
- Communications and information theory. The subject of our previous piece is this piece's §5.2 and §9.4 applied to : the asymptotic equipartition property is the strong law, its extension to ergodic sources is Shannon–McMillan–Breiman, the error exponents are Chernoff bounds (§7.1), and channel capacity is a mutual information whose achievability proof is a random-coding argument — a union bound over a random codebook, i.e. §7.5's finite-class bound with the roles of hypothesis and codeword exchanged.
The test the appendix applies is the same as the earlier piece's: a reading that only says what something resembles has produced no number, and gets no level.
Appendix C. Two toy cases that are ours, labelled as ours
This appendix is optional: the main text points to it (§12, §13) but does not depend on it.
C.1 The eval-set size that resolves a one-point gap, measured on E2
§7.6's table is a calculation. Here it is again as a calculation on a measured case, so it can be read against a case where the truth is known. On E2 at , the Bayes risk is and the logistic model trained on points had held-out error on examples (§4.3) — an excess of , resolved at that because the standard error there is . On a test set of the standard error would be : the gap to Bayes is a third of a standard error and the plateau is invisible. On it is , and the gap is standard errors — suggestive, unresolved. The number that resolved it was the , and the point of the calculation is that the same model reads as "at Bayes", "maybe above Bayes" and " standard errors above Bayes" depending only on . L3 as a design heuristic — "size the test set to the gap you want to see" — and L1 for each line of it.
C.2 The SGD curve inside its envelope
§8.4's four schedules were evaluated at four checkpoints. Run the constant-step chain and record the held-out error at every steps, and the curve has two components: a drift toward the neighbourhood the theorem promises, and a fluctuation whose size is set by the step. Every checkpoint is scored on the same held-out set of , so the estimator's noise is one shared draw, not a running mean, and the LIL envelope of §5.4 is the wrong bar for it; the right one is the fixed- band, per checkpoint. For the difference of two checkpoints the bar is not a multiple of that number. With the paired standard error is
and depends on how the two checkpoints' errors overlap, which the two accuracies alone do not tell you. Three overlap patterns at error each and :
§43 The paired standard error of a checkpoint difference is sqrt(Var(D_i)/n), and sqrt(2) x SE is not an upper bound
two classifiers, error rate 0.18 each, n = 50,000, D_i = 1{A wrong} - 1{B wrong}; per-classifier SE sqrt(0.18 * 0.82/n) = 0.00172, sqrt(2) x that = 0.00243
errors disjoint : P(both wrong) = 0.0000, Var(D) = 0.3600, exact SE(D-bar) = sqrt(Var(D)/n) = 0.00268 = 1.562 x per-classifier SE (above sqrt(2) x SE = 0.00243)
errors independent : P(both wrong) = 0.0324, Var(D) = 0.2952, exact SE(D-bar) = sqrt(Var(D)/n) = 0.00243 = 1.414 x per-classifier SE (below sqrt(2) x SE = 0.00243)
errors 90 % shared : P(both wrong) = 0.1620, Var(D) = 0.0360, exact SE(D-bar) = sqrt(Var(D)/n) = 0.00085 = 0.494 x per-classifier SE (below sqrt(2) x SE = 0.00243)
simulated disjoint case once, n = 50,000: mean D = +0.00388, empirical SE from the per-example D_i = sqrt(var(D)/n) = 0.00268 (exact 0.00268)The one is tempted to write is the independent-errors case, and it is not an upper bound: errors that never coincide give and a standard error of , larger by , while errors that mostly coincide — the usual case for two checkpoints of one run — give a much smaller one.
The pair compared next was not picked from the curve: it is the last two of the four checkpoints the §8.4 table fixed in advance (, , , ), so the reading is one pre-specified comparison and not a scan over the curve's recorded points. The checkpoints at () and () differ by , which is paired standard errors under the worst overlap pattern, and more under any other, and therefore a genuine change in the model's risk between the two checkpoints. That the change is the stationary wandering of §34(b) inside the iterate's neighbourhood rather than drift is what the AR(1) model says, not what this test shows — a deterministic trajectory changes its risk too.
The number to report is neither closed form but the one computed from the stored per-example — the same per-example predictions §7.6's McNemar block works from. The experiment separates the two noises a loss curve mixes — the estimator's, bounded by the fixed- CLT band, and the optimiser's, bounded by the step — and only the first is reduced by a bigger test set. L3 as a reading of a curve; the two bounds are L1.
Action changed: a difference between two checkpoints, or two models, scored on one held-out set gets its error bar from the per-example differences, , so store the per-example predictions and not only the accuracies; times the single-model bar is the independent-errors case — too small by here when the errors are disjoint, too large when they mostly coincide. A difference beyond that bar says the two risks differ, not why they do.
Appendix D. How this piece bears on our earlier posts, graded
This appendix is optional: it exists for readers of our earlier tutorials and for us, and nothing in the main text depends on it. It is graded on the four-level scale from the introduction, and only the rows where the probabilistic reading changes an action get more than a line.
D.1 Four connections that change an action
The GP of W28 is the width limit of the network, by the central limit theorem (L1 at initialisation, L2 trained). §6.6. Our Gaussian-process piece presented the GP as a model with a chosen kernel; the CLT says a randomly initialised wide network is a GP whose kernel the architecture determines (arc-cosine for ReLU), with the excess kurtosis measured to vanish by width . The action it changes: a kernel chosen for a GP is a statement about an architecture's prior, so before claiming a wide network learned a structure, compute the NNGP (or NTK) prediction with the same kernel on the same data and report the gap — the kernel regression the architecture already implied is the baseline, not zero (§6.6's card and its Action-changed box say the same, with the finite-width excess kurtosis and its per-width Monte Carlo error as the measure of how far from the limit a given width sits). The same section grades W28's kernel view of attention unchanged at the earlier piece's L4 — not for want of a limit theorem, since attention with infinitely many heads has an NNGP/NTK limit too (Hron, Bahri, Sohl-Dickstein & Novak (2020), "Infinite attention", ICML 2020), but because the kernel reading is of a finite softmax matrix, which no limit theorem turns into a Gaussian process.
The diffusion sampler of W29 is an exact time reversal, and its loss is a KL on path space (L1), while its schedule is a diagnostic (L3). §9.4. Our probabilistic-3D piece used the reverse process heuristically; Anderson's theorem makes it exact with the true score, and Girsanov makes the likelihood-weighted denoising objective a bound on the expected negative log-likelihood, the per-sample bound being a separate theorem (§9.4; §13 item 10). The action it changes: a diffusion model's failure is a score-estimation failure, a discretisation failure or a finite-horizon failure (the reversal starts from a stand-in for , not from : the term of §9.4, which the §26 run also pays by starting from the centred ) — the reversal itself has no error — so diagnose those three, and read the schedule as our Information Domain piece's §7 did, as a diagnostic rather than a budget.
The minimax of W35 is two games (L2 for the GAN as a game, L1 for its inner value as a divergence). §10.4. Our game-inside-the-network piece and its basics companion treated GAN training as a minimax game; this piece keeps that game apart from statistical minimax (§10.4; §13 item 6). The action it changes: when a GAN "loses the game", one thing that may have happened is that a divergence saturated (§2.4) — mode collapse and limit cycles are failures of a different kind — so check the supports and the discriminator's accuracy on an independent sample (evidence about its Bayes accuracy , not a measurement of it) before touching the game-theoretic machinery.
The rollouts of W33 are averages with a precondition that depends on the problem (L1). §9.5. Our planning-under-uncertainty piece estimated values from rollouts; the ergodic theorem licenses that only for an irreducible positive-recurrent chain, which an episodic task with absorbing states is not. The action it changes: evaluate episodic agents on independent episodes, not on one long run — the strong law across i.i.d. episode returns is what licenses the average, and the unit of the error bar is the episode, not the step; for a continuing task, report the effective sample size of the rollout rather than its length. The policy gradient is the same distinction in a formula: under a discount its expectation is over the normalised discounted occupancy and carries the prefactor when — an average over -weighted visits across episodes — while the average-reward form uses the stationary law and the differential action value; neither is the plain time average of one run, and the gap does not shrink with the run (§9.5).
D.2 The rest, as links and levels
W41 Information Domain — its typical set is §1.6's measure statement and §9.4's Shannon–McMillan–Breiman, its cross-entropy floor is §4.3's projection with the log-loss, its KL asymmetry is §2.4's absolute continuity, its hypothesis-testing exponents are §8.5's sequential test, its mutual-information bounds are §10.4's variational representation, its entropy-rate AR(1) is this piece's E4, and its §9.8 maximum-entropy Gaussian is §6.5's CLT endpoint: L1 on every row, which is why the two read as chapters. W39 Frequency Domain and W40 Bochner — the characteristic function is the Fourier transform of a law, the convolution theorem is the independence rule, Bochner's class is the class of characteristic functions, and random Fourier features are Hoeffding on Bochner: L1 (§6.1, §7.3). W40 Fourier transforms explained — spectral bias as a statement about a kernel's eigenvalues is L2 here; the probabilistic version is §6.6's NTK. W28 why uncertainty matters — the aleatoric/epistemic split is the law of total variance, L1, with the caveat that the split depends on which σ-algebra you condition on (§4.2). W15 post-transformer architectures — a fixed-size state is a conditional-independence assertion, L2 (§11.1); the capacity question the earlier piece asked is well posed because of it. W13 energy-based world models — an energy is a Gibbs factorisation by Hammersley–Clifford and is sampled by Langevin, L1 for the theorems, L2 for the reading of JEPA-style objectives (§11.1, §9.3). W32 neuro-symbolic reasoning — a Bayesian network's d-separation is the exact semantics of the conditional-independence claims a symbolic layer makes, L1 (§11.1). W36 self-play — a self-play curriculum is a non-stationary Markov chain over opponents, and whether its time averages mean anything is §9.1's ergodicity question: L3, a reading without a derivation in that piece.
The tempting closing line is "it was all measure theory the whole time". It fails the test of Appendix B: a connection earns its level by producing a number — a Bayes risk you cannot beat, an envelope a curve cannot stay inside, an effective sample size, a rate no estimator improves — and the rows above are graded by that test and by nothing else.
Where to go next
The companion script worked_numbers.py behind every number in this piece ships with it — numbered sections, NumPy only, seeded, about two and a quarter minutes on a laptop (135 s) — with test_worked_numbers.py beside it as the under-a-minute deterministic check of the exact formulas the piece quotes — and the two notebooks named in the introduction ship beside it, built from its sections: 00_probability_from_scratch.ipynb constructs a probability space for E1, computes Bertrand's three measures and the great circle's two kernels, verifies the projection theorem's orthogonality and Pythagoras, runs the typewriter and escaping-mass sequences, draws the LIL envelope over two million coins, proves the CLT numerically by characteristic functions with its Berry–Esseen slack, and measures the Gaussian annulus, the cosines, Johnson–Lindenstrauss and the covariance error at every in §7; 01_concentration_and_chains.ipynb carries the eval-set calculation of Appendix C.1, the peeking experiment with its test martingale, the four SGD schedules with their fixed- test-set bands, the AR(1) and Metropolis chains with their effective sample sizes, the unadjusted Langevin bias, the exact-score diffusion reversal, the Pólya urn, and the infinite-width network against the arc-cosine kernel. 02_fast_path.ipynb runs only the fast-path sections' numbers — the script sections quoted inside the fourteen banner-marked stops, with the same per-section generator state — so that a two-hour reader can execute exactly what they read and nothing else.
If you want the foundations at a slower pace, two companion explainers are planned for the following cycle — one on measure and conditioning from first principles, one on concentration and the eval error bar with fewer assumed prerequisites — and the piece after that takes §4.5, §10.1 and §11.2 forward into Bayesian and non-parametric inference.
For the canonical references, in the order a reader should meet them: Williams's Probability with Martingales (1991) is the shortest honest route from §1 to §8 and the one to read first if you read one. Billingsley's Probability and Measure (3rd ed., 1995) is the standard for §1 to §6 — Vitali, extension, conditioning and the characteristic-function proof of the CLT are all there with every detail. Durrett's Probability: Theory and Examples (5th ed., 2019) covers the same ground with the law of the iterated logarithm, martingales and the ergodic theorem, and is freely available from the author's site. Vershynin's High-Dimensional Probability (2018), also free from the author, is §7 at full strength and the one book on this list written with contemporary machine learning in view; its first five chapters are the concentration toolkit, and the random-matrix and covariance results of §7.4 are its Chapter 4. Kolmogorov's Foundations of the Theory of Probability (1933; the 1956 English translation is fifty pages) is the origin of §1, §4.1 and the extension theorem, and reads as a modern paper. For §9 and §10, Tsybakov's Introduction to Nonparametric Estimation (2009) is the minimax lower-bound machinery of §10.2 and §10.3, and Meyn & Tweedie's Markov Chains and Stochastic Stability is the ergodic theory under MCMC. The older literature is worth the detour — Feller's two volumes, Loève, Halmos's Measure Theory (1950) for the measure-theoretic half, and Doob's Stochastic Processes (1953) for the martingale half — because the questions those books were answering are the questions this piece is answering, and their examples are the ones that still break intuition.
We build agent systems and practitioner tooling at Artifocial, and this lens shows up directly in the products — every one of them is estimating something from a sample, stopping on a monitored signal, or conditioning on an observation, and this piece is about knowing which of those are theorems. See our apps, including Alarmly.